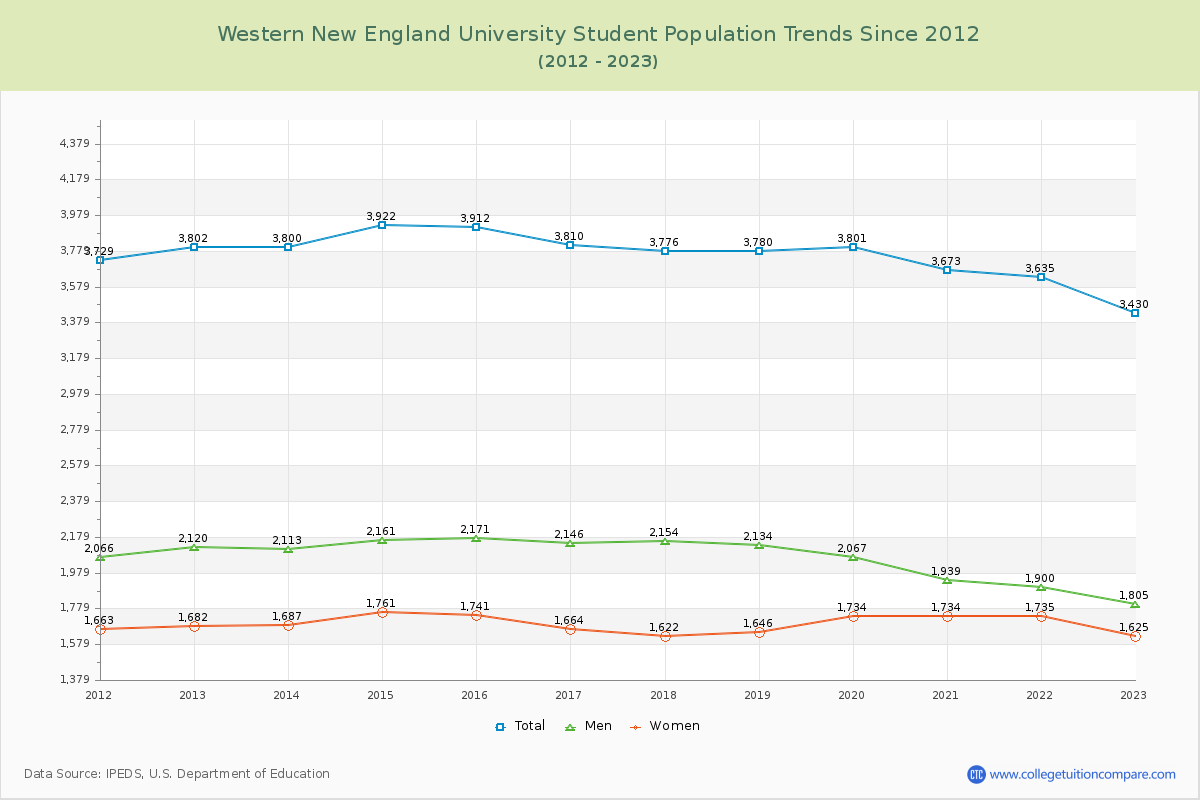
Student Population Changes
The average student population over the last 12 years is 3,758 where 3,430 students are attending the school for the academic year 2022-2023.
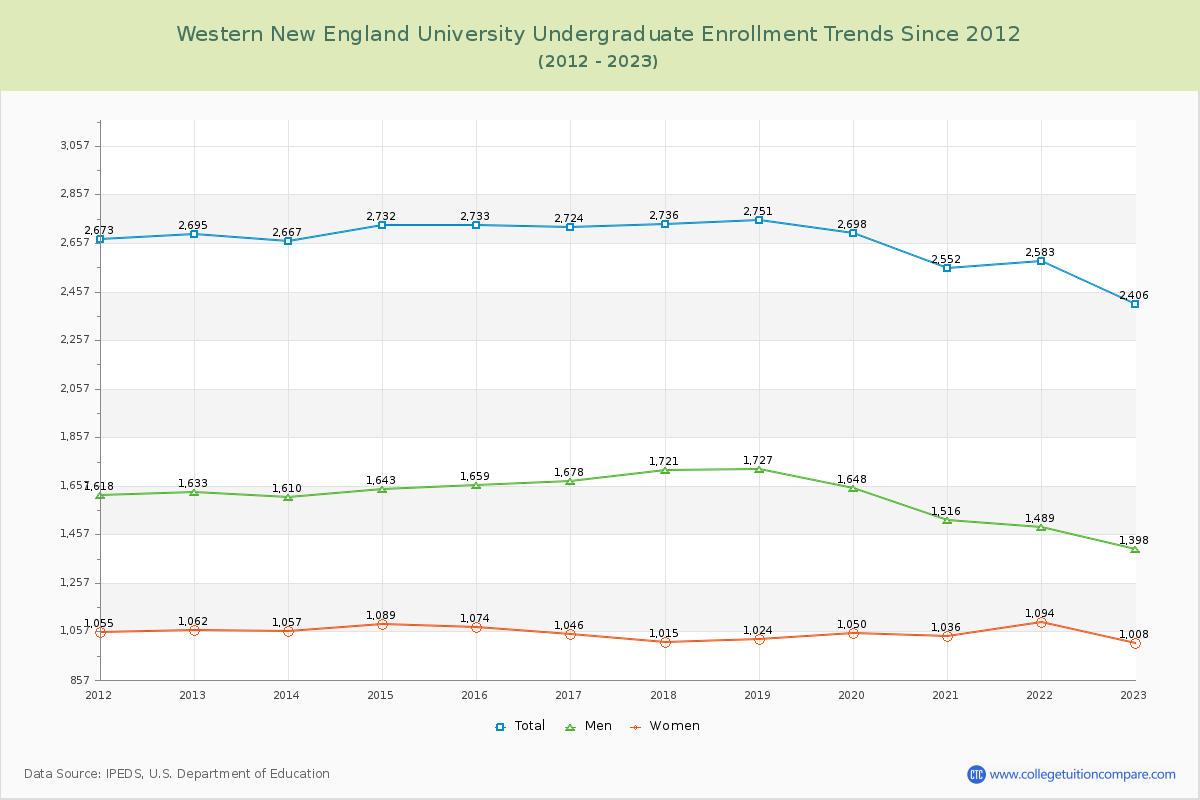
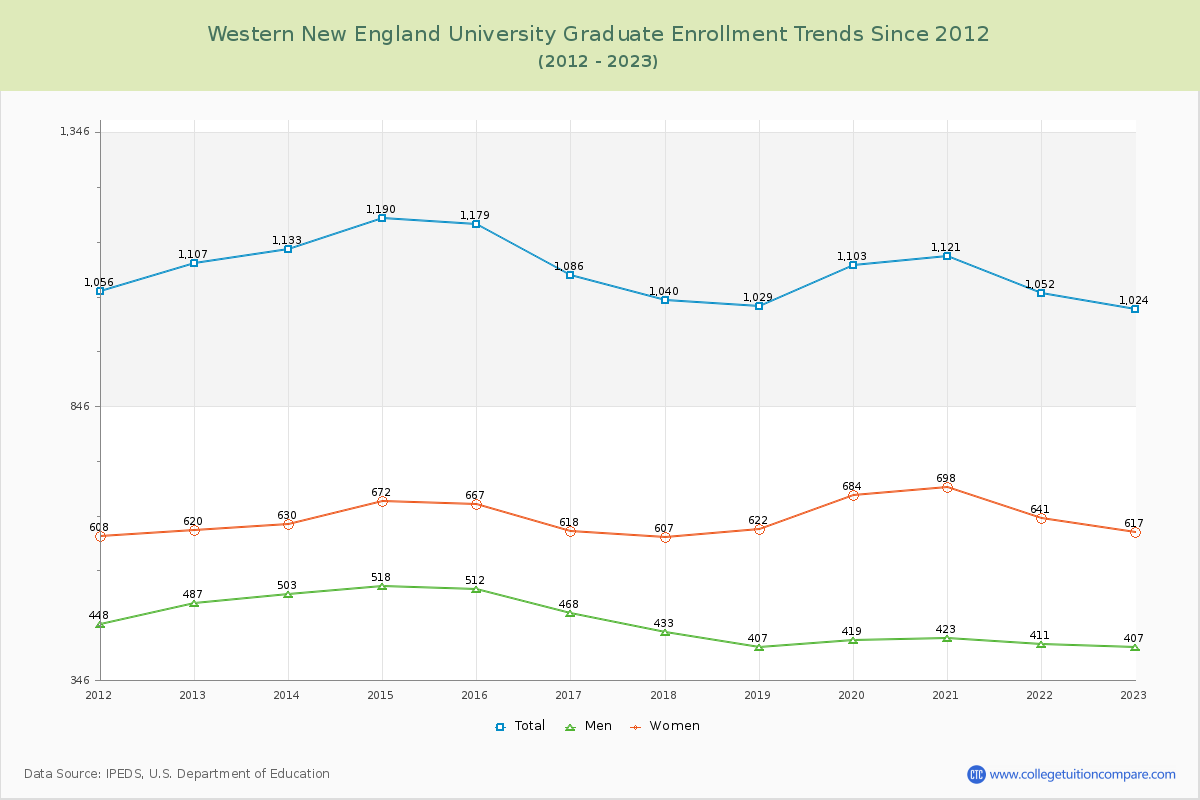
70.15% of total students is undergraduate students and 29.85% students is graduate students. The number of undergraduate students has decreased by 289 and the graduate enrollment has decreased by 83 over past 10 years.
The female to male ratio is 0.90 to 1 and it means that there are slightly more male students enrolled in WNE than female students.
The following table and chart illustrate the changes in student population by gender at Western New England University since 2012.
| Year | Total | Undergraduate | Graduate | ||||
|---|---|---|---|---|---|---|---|
| Total | Men | Women | Total | Men | Women | ||
| 2012-13 | 3,802 | 2,695 | 1,633 | 1,062 | 1,107 | 487 | 620 |
| 2013-14 | 3,800 -2 | 2,667 -28 | 1,610 -23 | 1,057 -5 | 1,133 26 | 503 16 | 630 10 |
| 2014-15 | 3,922 122 | 2,732 65 | 1,643 33 | 1,089 32 | 1,190 57 | 518 15 | 672 42 |
| 2015-16 | 3,912 -10 | 2,733 1 | 1,659 16 | 1,074 -15 | 1,179 -11 | 512 -6 | 667 -5 |
| 2016-17 | 3,810 -102 | 2,724 -9 | 1,678 19 | 1,046 -28 | 1,086 -93 | 468 -44 | 618 -49 |
| 2017-18 | 3,776 -34 | 2,736 12 | 1,721 43 | 1,015 -31 | 1,040 -46 | 433 -35 | 607 -11 |
| 2018-19 | 3,780 4 | 2,751 15 | 1,727 6 | 1,024 9 | 1,029 -11 | 407 -26 | 622 15 |
| 2019-20 | 3,801 21 | 2,698 -53 | 1,648 -79 | 1,050 26 | 1,103 74 | 419 12 | 684 62 |
| 2020-21 | 3,673 -128 | 2,552 -146 | 1,516 -132 | 1,036 -14 | 1,121 18 | 423 4 | 698 14 |
| 2021-22 | 3,635 -38 | 2,583 31 | 1,489 -27 | 1,094 58 | 1,052 -69 | 411 -12 | 641 -57 |
| 2022-23 | 3,430 -205 | 2,406 -177 | 1,398 -91 | 1,008 -86 | 1,024 -28 | 407 -4 | 617 -24 |
| Average | 3,758 | 2,662 | 1,611 | 1,050 | 1,097 | 453 | 643 |