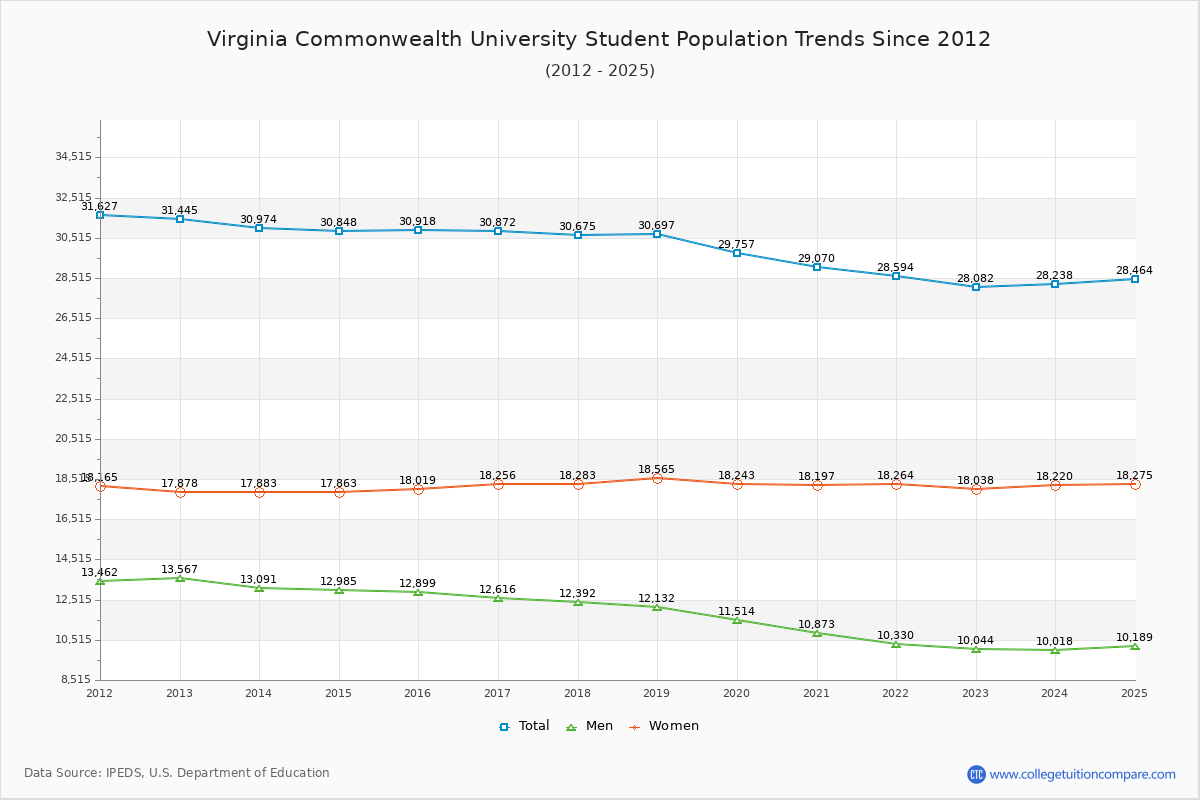
Student Population Changes
The average student population over the last 12 years is 30,176 where 28,082 students are attending the school for the academic year 2022-2023.
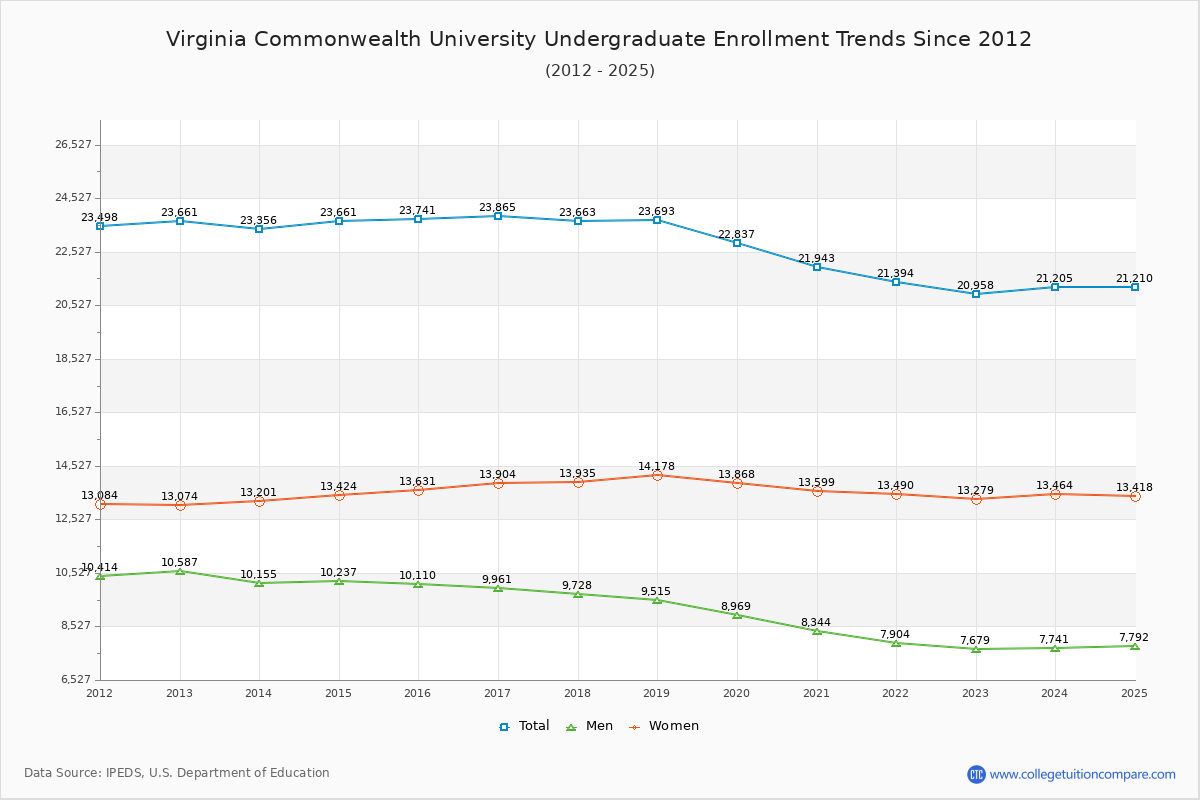
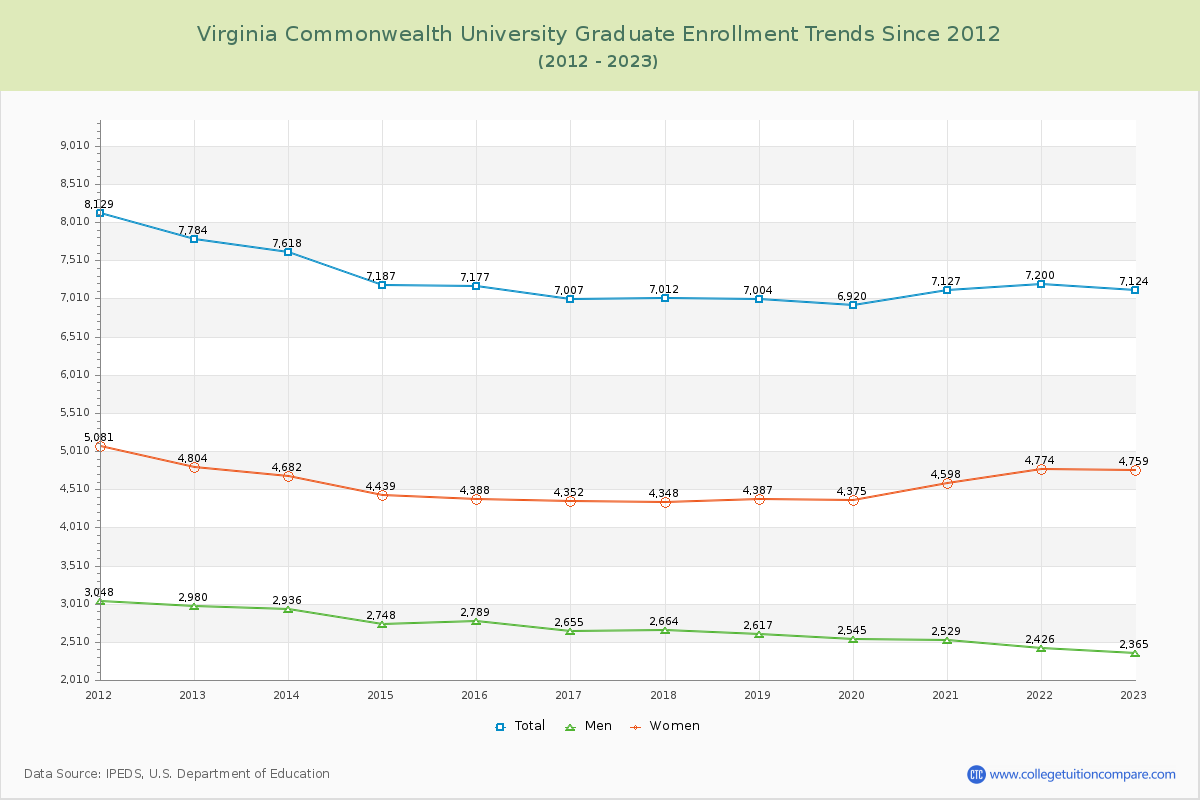
74.63% of total students is undergraduate students and 25.37% students is graduate students. The number of undergraduate students has decreased by 2,703 and the graduate enrollment has decreased by 660 over past 10 years.
The female to male ratio is 1.80 to 1 and it means that there are more female students enrolled in VCU than male students.
The following table and chart illustrate the changes in student population by gender at Virginia Commonwealth University since 2012.
| Year | Total | Undergraduate | Graduate | ||||
|---|---|---|---|---|---|---|---|
| Total | Men | Women | Total | Men | Women | ||
| 2012-13 | 31,445 | 23,661 | 10,587 | 13,074 | 7,784 | 2,980 | 4,804 |
| 2013-14 | 30,974 -471 | 23,356 -305 | 10,155 -432 | 13,201 127 | 7,618 -166 | 2,936 -44 | 4,682 -122 |
| 2014-15 | 30,848 -126 | 23,661 305 | 10,237 82 | 13,424 223 | 7,187 -431 | 2,748 -188 | 4,439 -243 |
| 2015-16 | 30,918 70 | 23,741 80 | 10,110 -127 | 13,631 207 | 7,177 -10 | 2,789 41 | 4,388 -51 |
| 2016-17 | 30,872 -46 | 23,865 124 | 9,961 -149 | 13,904 273 | 7,007 -170 | 2,655 -134 | 4,352 -36 |
| 2017-18 | 30,675 -197 | 23,663 -202 | 9,728 -233 | 13,935 31 | 7,012 5 | 2,664 9 | 4,348 -4 |
| 2018-19 | 30,697 22 | 23,693 30 | 9,515 -213 | 14,178 243 | 7,004 -8 | 2,617 -47 | 4,387 39 |
| 2019-20 | 29,757 -940 | 22,837 -856 | 8,969 -546 | 13,868 -310 | 6,920 -84 | 2,545 -72 | 4,375 -12 |
| 2020-21 | 29,070 -687 | 21,943 -894 | 8,344 -625 | 13,599 -269 | 7,127 207 | 2,529 -16 | 4,598 223 |
| 2021-22 | 28,594 -476 | 21,394 -549 | 7,904 -440 | 13,490 -109 | 7,200 73 | 2,426 -103 | 4,774 176 |
| 2022-23 | 28,082 -512 | 20,958 -436 | 7,679 -225 | 13,279 -211 | 7,124 -76 | 2,365 -61 | 4,759 -15 |
| Average | 30,176 | 22,979 | 9,381 | 13,598 | 7,196 | 2,659 | 4,537 |