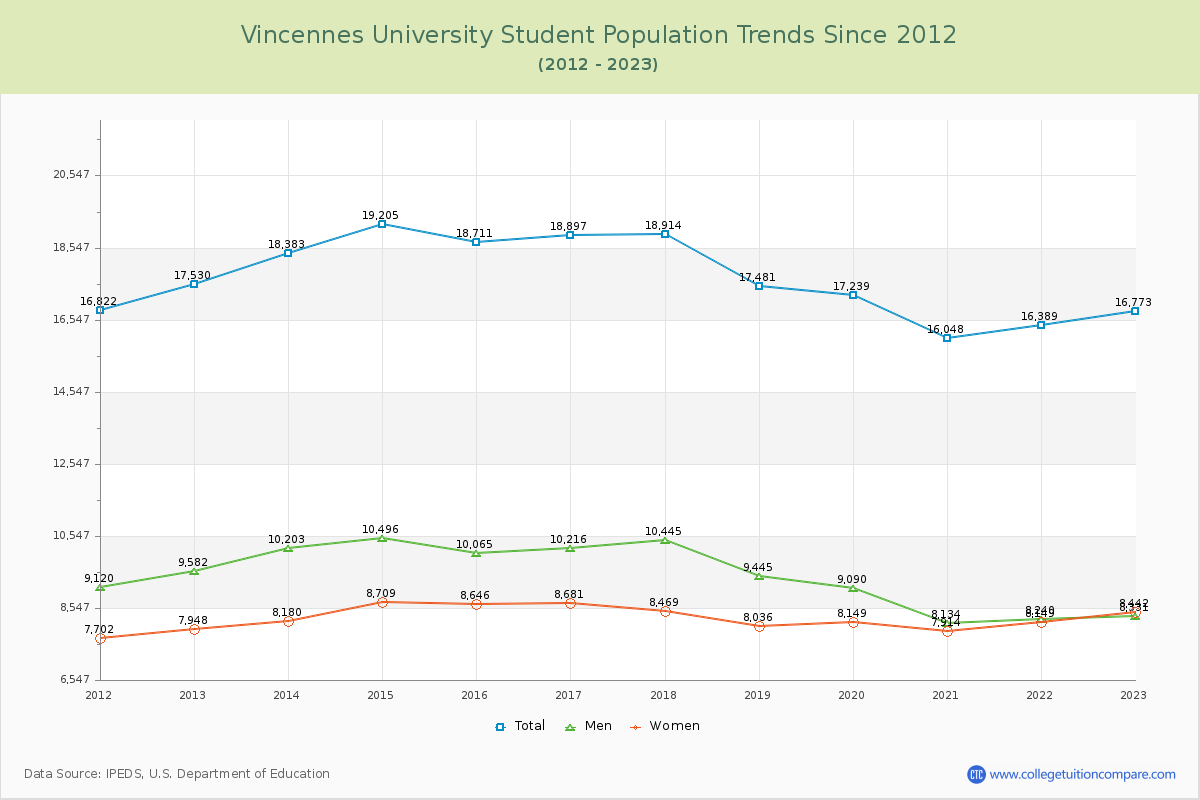
Student Population Changes
The average student population over the last 12 years is 17,779 where 16,773 students are attending the school for the academic year 2022-2023.
The female to male ratio is 1.01 to 1 and it means that there are similar numbers of female and male students enrolled in Vincennes.
The following table and chart illustrate the changes in student population by gender at Vincennes University since 2012.
| Year | Total | Men | Women |
|---|---|---|---|
| 2012-13 | 17,530 | 9,582 | 7,948 |
| 2013-14 | 18,383 853 | 10,203 621 | 8,180 232 |
| 2014-15 | 19,205 822 | 10,496 293 | 8,709 529 |
| 2015-16 | 18,711 -494 | 10,065 -431 | 8,646 -63 |
| 2016-17 | 18,897 186 | 10,216 151 | 8,681 35 |
| 2017-18 | 18,914 17 | 10,445 229 | 8,469 -212 |
| 2018-19 | 17,481 -1,433 | 9,445 -1,000 | 8,036 -433 |
| 2019-20 | 17,239 -242 | 9,090 -355 | 8,149 113 |
| 2020-21 | 16,048 -1,191 | 8,134 -956 | 7,914 -235 |
| 2021-22 | 16,389 341 | 8,240 106 | 8,149 235 |
| 2022-23 | 16,773 384 | 8,331 91 | 8,442 293 |
| Average | 17,779 | 9,477 | 8,302 |