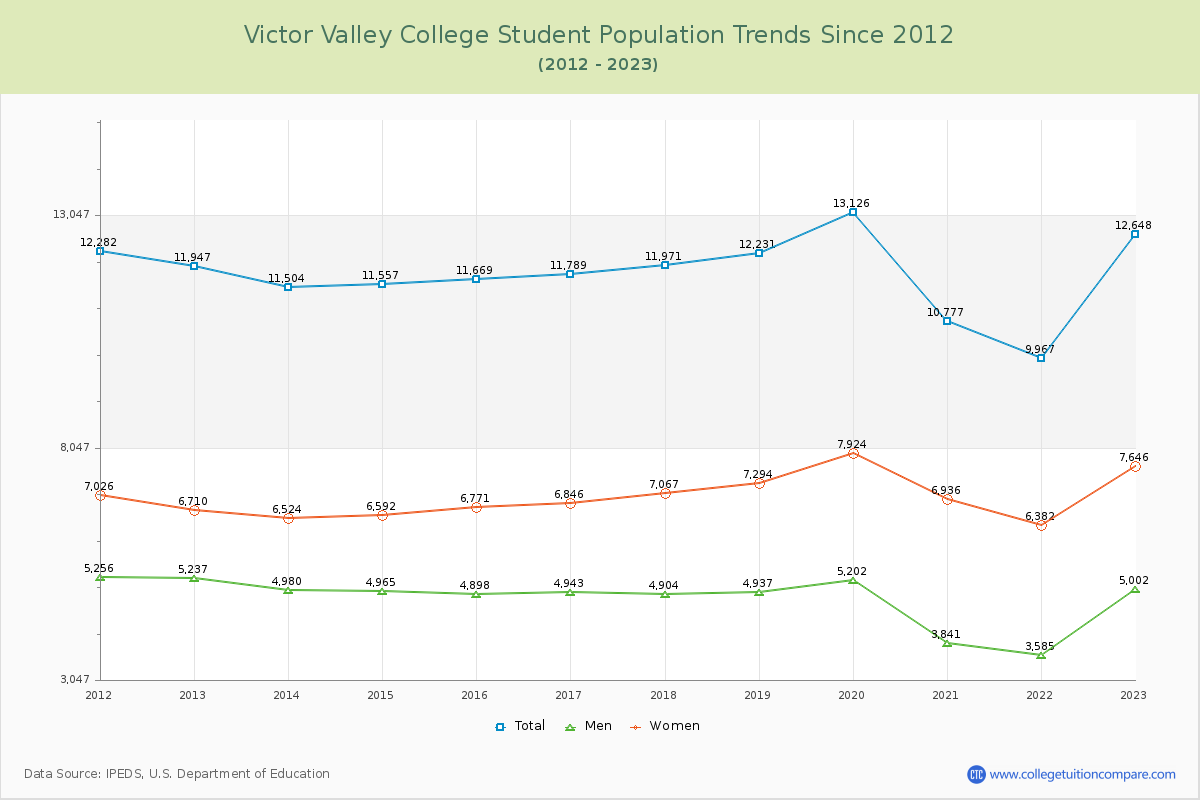
Student Population Changes
The average student population over the last 12 years is 11,744 where 12,648 students are attending the school for the academic year 2022-2023.
The female to male ratio is 1.53 to 1 and it means that there are more female students enrolled in Victor Valley than male students.
The following table and chart illustrate the changes in student population by gender at Victor Valley College since 2012.
| Year | Total | Men | Women |
|---|---|---|---|
| 2012-13 | 11,947 | 5,237 | 6,710 |
| 2013-14 | 11,504 -443 | 4,980 -257 | 6,524 -186 |
| 2014-15 | 11,557 53 | 4,965 -15 | 6,592 68 |
| 2015-16 | 11,669 112 | 4,898 -67 | 6,771 179 |
| 2016-17 | 11,789 120 | 4,943 45 | 6,846 75 |
| 2017-18 | 11,971 182 | 4,904 -39 | 7,067 221 |
| 2018-19 | 12,231 260 | 4,937 33 | 7,294 227 |
| 2019-20 | 13,126 895 | 5,202 265 | 7,924 630 |
| 2020-21 | 10,777 -2,349 | 3,841 -1,361 | 6,936 -988 |
| 2021-22 | 9,967 -810 | 3,585 -256 | 6,382 -554 |
| 2022-23 | 12,648 2,681 | 5,002 1,417 | 7,646 1,264 |
| Average | 11,744 | 4,772 | 6,972 |