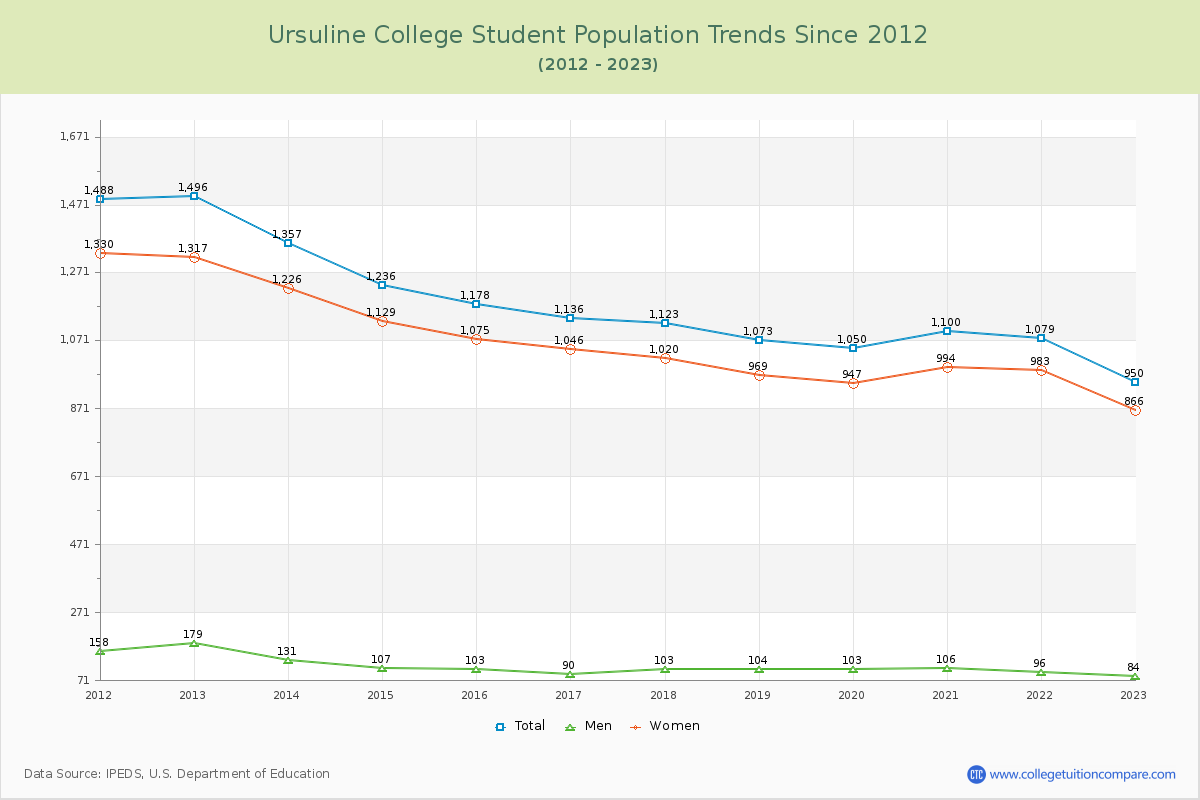
Student Population Changes
The average student population over the last 12 years is 1,162 where 950 students are attending the school for the academic year 2022-2023.
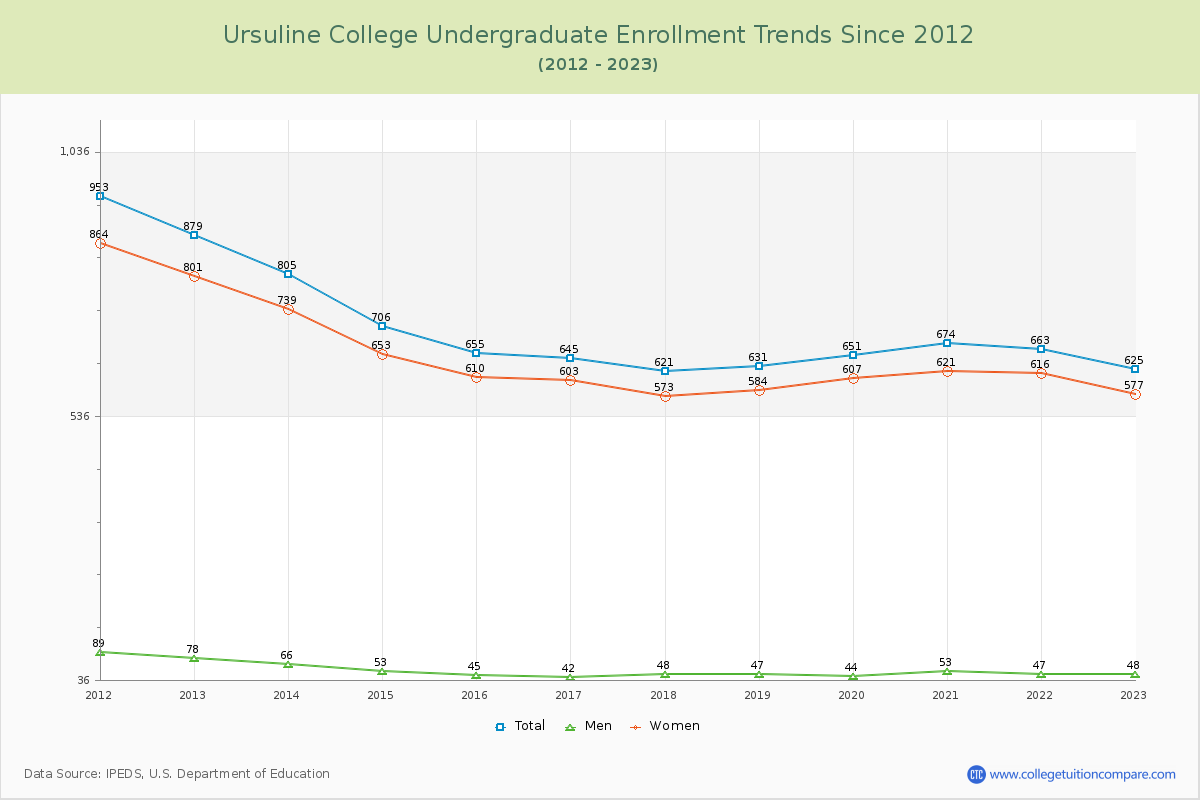
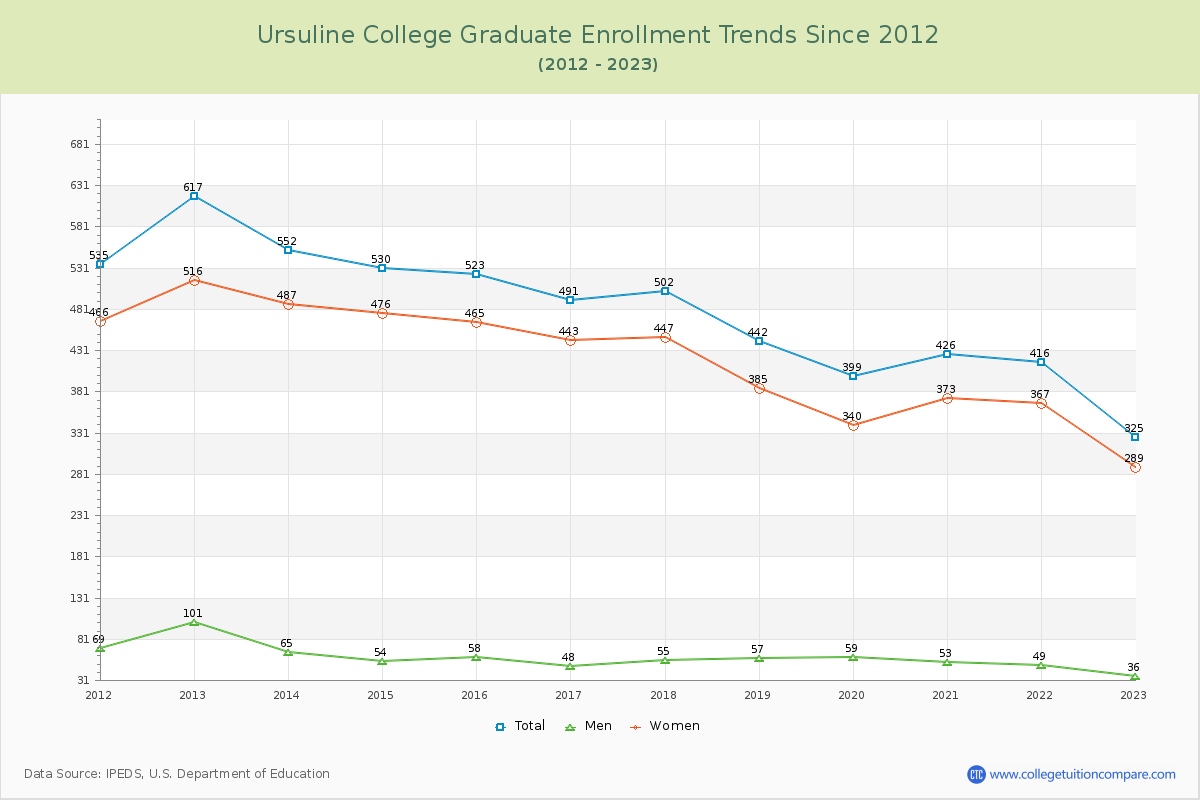
65.79% of total students is undergraduate students and 34.21% students is graduate students. The number of undergraduate students has decreased by 254 and the graduate enrollment has decreased by 292 over past 10 years.
The female to male ratio is 10.31 to 1 and it means that there are far more female students enrolled in Ursuline than male students.
The following table and chart illustrate the changes in student population by gender at Ursuline College since 2012.
| Year | Total | Undergraduate | Graduate | ||||
|---|---|---|---|---|---|---|---|
| Total | Men | Women | Total | Men | Women | ||
| 2012-13 | 1,496 | 879 | 78 | 801 | 617 | 101 | 516 |
| 2013-14 | 1,357 -139 | 805 -74 | 66 -12 | 739 -62 | 552 -65 | 65 -36 | 487 -29 |
| 2014-15 | 1,236 -121 | 706 -99 | 53 -13 | 653 -86 | 530 -22 | 54 -11 | 476 -11 |
| 2015-16 | 1,178 -58 | 655 -51 | 45 -8 | 610 -43 | 523 -7 | 58 4 | 465 -11 |
| 2016-17 | 1,136 -42 | 645 -10 | 42 -3 | 603 -7 | 491 -32 | 48 -10 | 443 -22 |
| 2017-18 | 1,123 -13 | 621 -24 | 48 6 | 573 -30 | 502 11 | 55 7 | 447 4 |
| 2018-19 | 1,073 -50 | 631 10 | 47 -1 | 584 11 | 442 -60 | 57 2 | 385 -62 |
| 2019-20 | 1,050 -23 | 651 20 | 44 -3 | 607 23 | 399 -43 | 59 2 | 340 -45 |
| 2020-21 | 1,100 50 | 674 23 | 53 9 | 621 14 | 426 27 | 53 -6 | 373 33 |
| 2021-22 | 1,079 -21 | 663 -11 | 47 -6 | 616 -5 | 416 -10 | 49 -4 | 367 -6 |
| 2022-23 | 950 -129 | 625 -38 | 48 1 | 577 -39 | 325 -91 | 36 -13 | 289 -78 |
| Average | 1,162 | 687 | 52 | 635 | 475 | 58 | 417 |