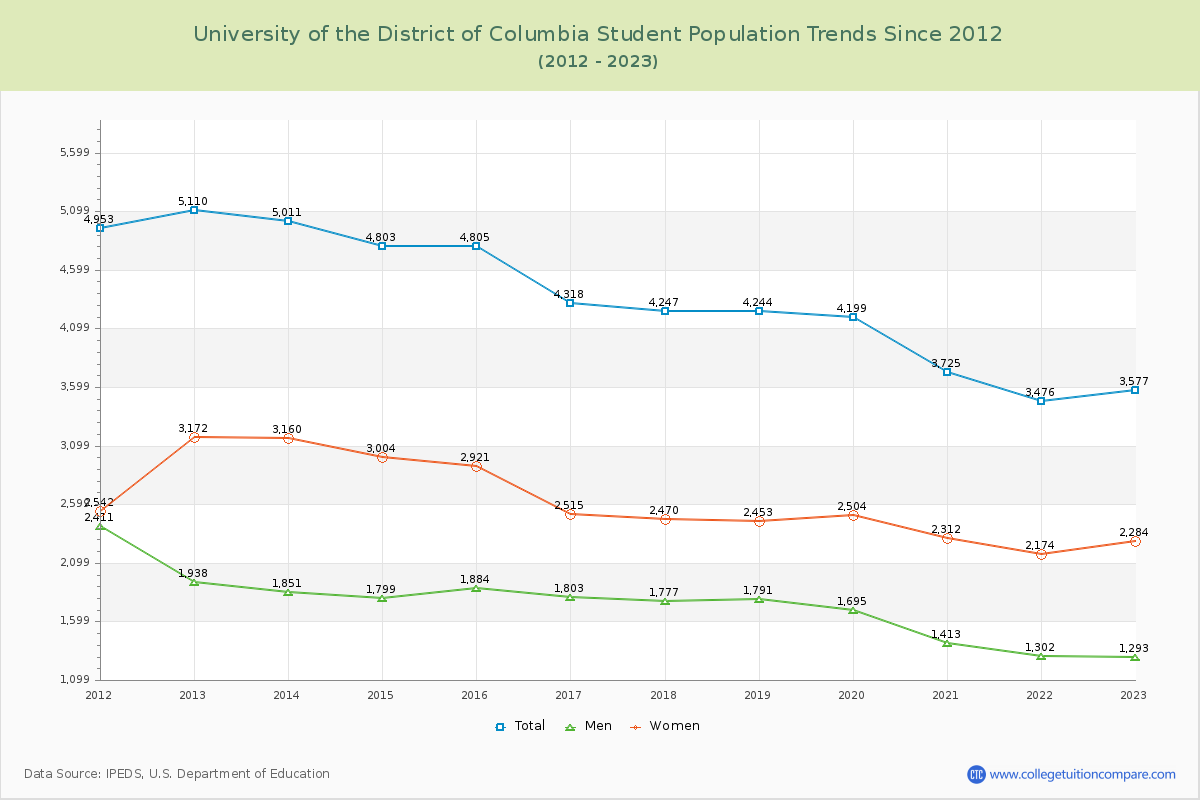
Student Population Changes
The average student population over the last 12 years is 4,320 where 3,577 students are attending the school for the academic year 2022-2023.
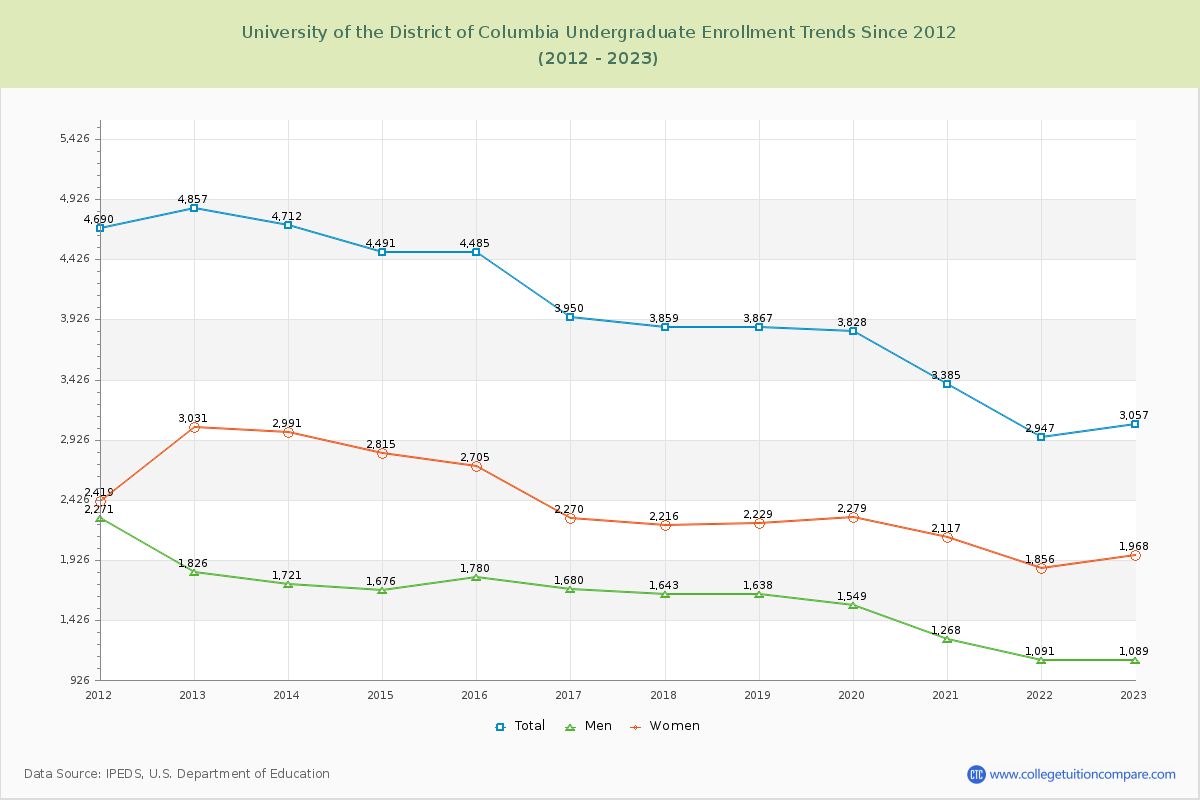
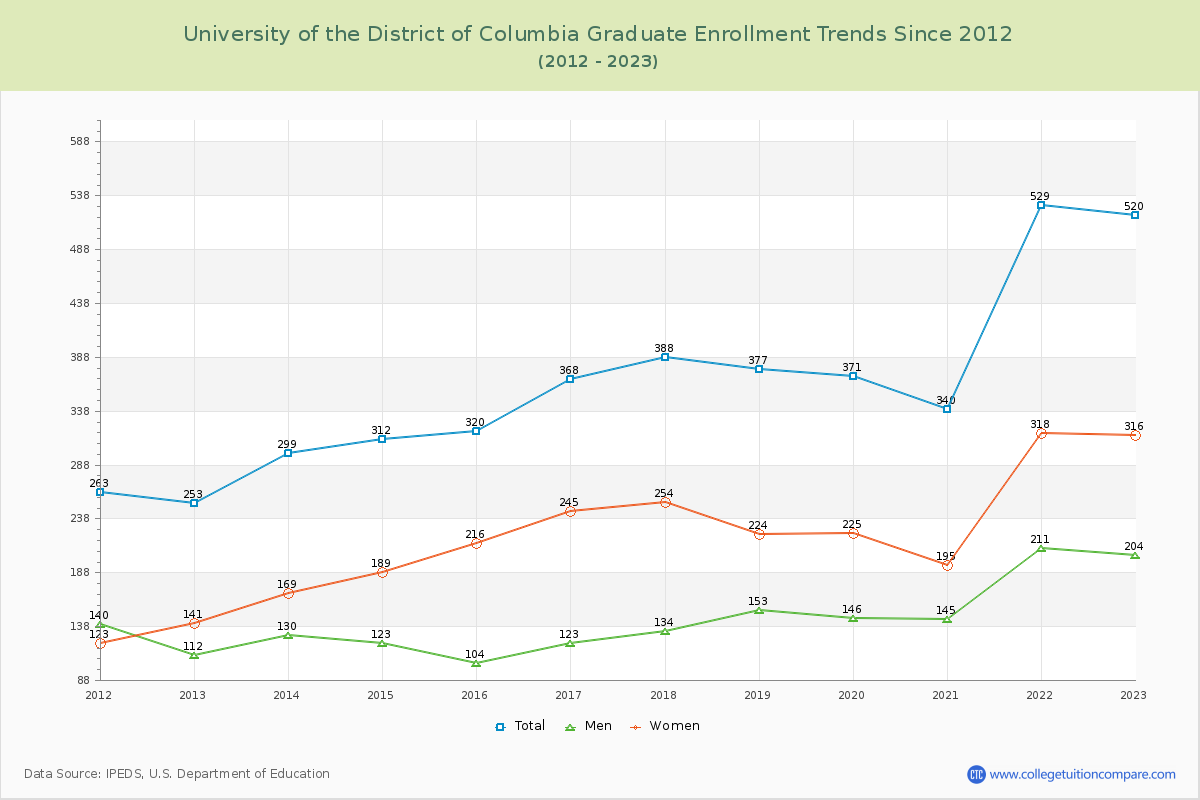
85.46% of total students is undergraduate students and 14.54% students is graduate students. The number of undergraduate students has decreased by 1,800 and the graduate enrollment has increased by 267 over past 10 years.
The female to male ratio is 1.77 to 1 and it means that there are more female students enrolled in U of the District of Columbia than male students.
The following table and chart illustrate the changes in student population by gender at University of the District of Columbia since 2012.
| Year | Total | Undergraduate | Graduate | ||||
|---|---|---|---|---|---|---|---|
| Total | Men | Women | Total | Men | Women | ||
| 2012-13 | 5,110 | 4,857 | 1,826 | 3,031 | 253 | 112 | 141 |
| 2013-14 | 5,011 -99 | 4,712 -145 | 1,721 -105 | 2,991 -40 | 299 46 | 130 18 | 169 28 |
| 2014-15 | 4,803 -208 | 4,491 -221 | 1,676 -45 | 2,815 -176 | 312 13 | 123 -7 | 189 20 |
| 2015-16 | 4,805 2 | 4,485 -6 | 1,780 104 | 2,705 -110 | 320 8 | 104 -19 | 216 27 |
| 2016-17 | 4,318 -487 | 3,950 -535 | 1,680 -100 | 2,270 -435 | 368 48 | 123 19 | 245 29 |
| 2017-18 | 4,247 -71 | 3,859 -91 | 1,643 -37 | 2,216 -54 | 388 20 | 134 11 | 254 9 |
| 2018-19 | 4,244 -3 | 3,867 8 | 1,638 -5 | 2,229 13 | 377 -11 | 153 19 | 224 -30 |
| 2019-20 | 4,199 -45 | 3,828 -39 | 1,549 -89 | 2,279 50 | 371 -6 | 146 -7 | 225 1 |
| 2020-21 | 3,725 -474 | 3,385 -443 | 1,268 -281 | 2,117 -162 | 340 -31 | 145 -1 | 195 -30 |
| 2021-22 | 3,476 -249 | 2,947 -438 | 1,091 -177 | 1,856 -261 | 529 189 | 211 66 | 318 123 |
| 2022-23 | 3,577 101 | 3,057 110 | 1,089 -2 | 1,968 112 | 520 -9 | 204 -7 | 316 -2 |
| Average | 4,320 | 3,949 | 1,542 | 2,407 | 371 | 144 | 227 |