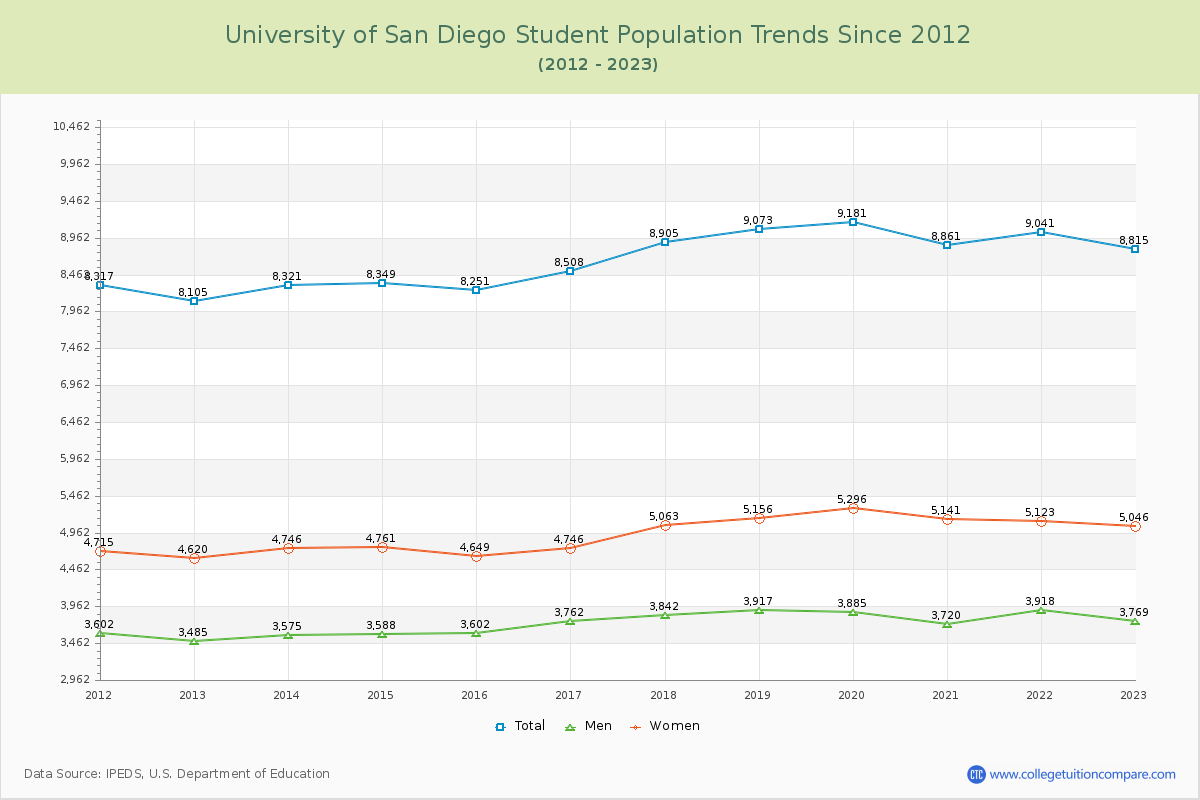
Student Population Changes
The average student population over the last 12 years is 8,674 where 8,815 students are attending the school for the academic year 2022-2023.
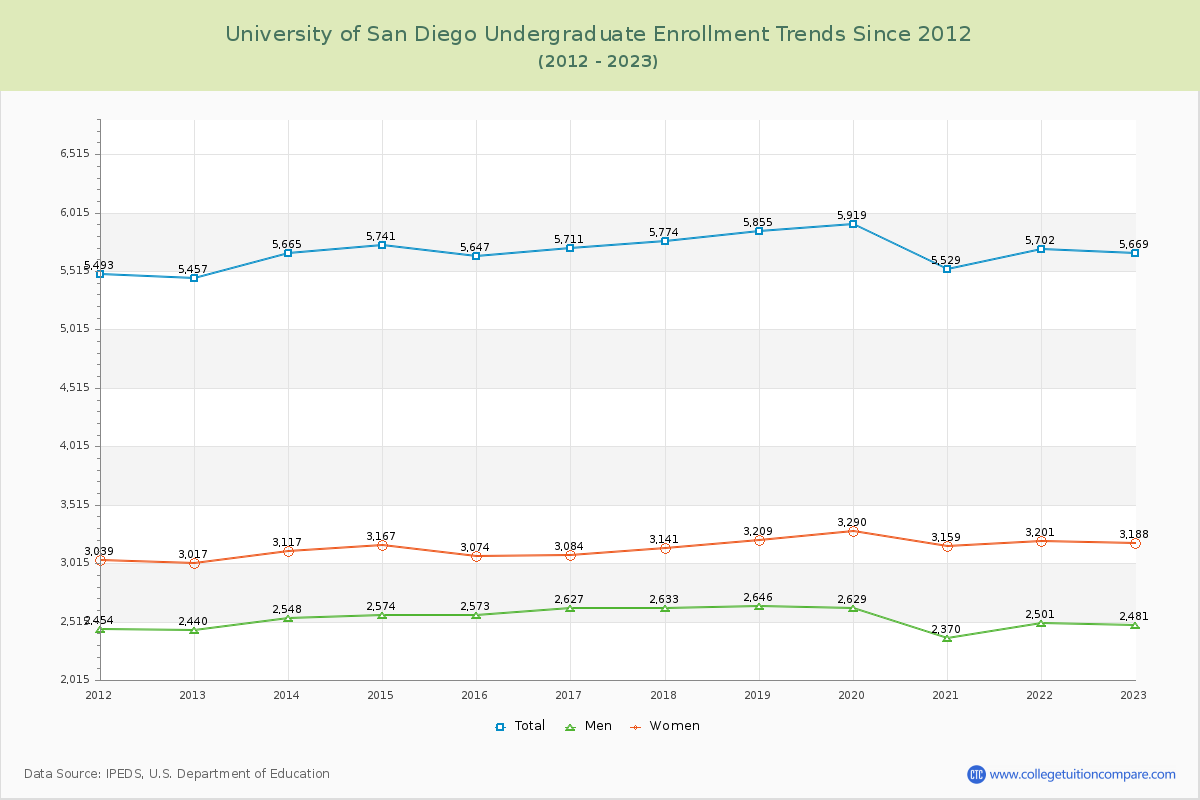
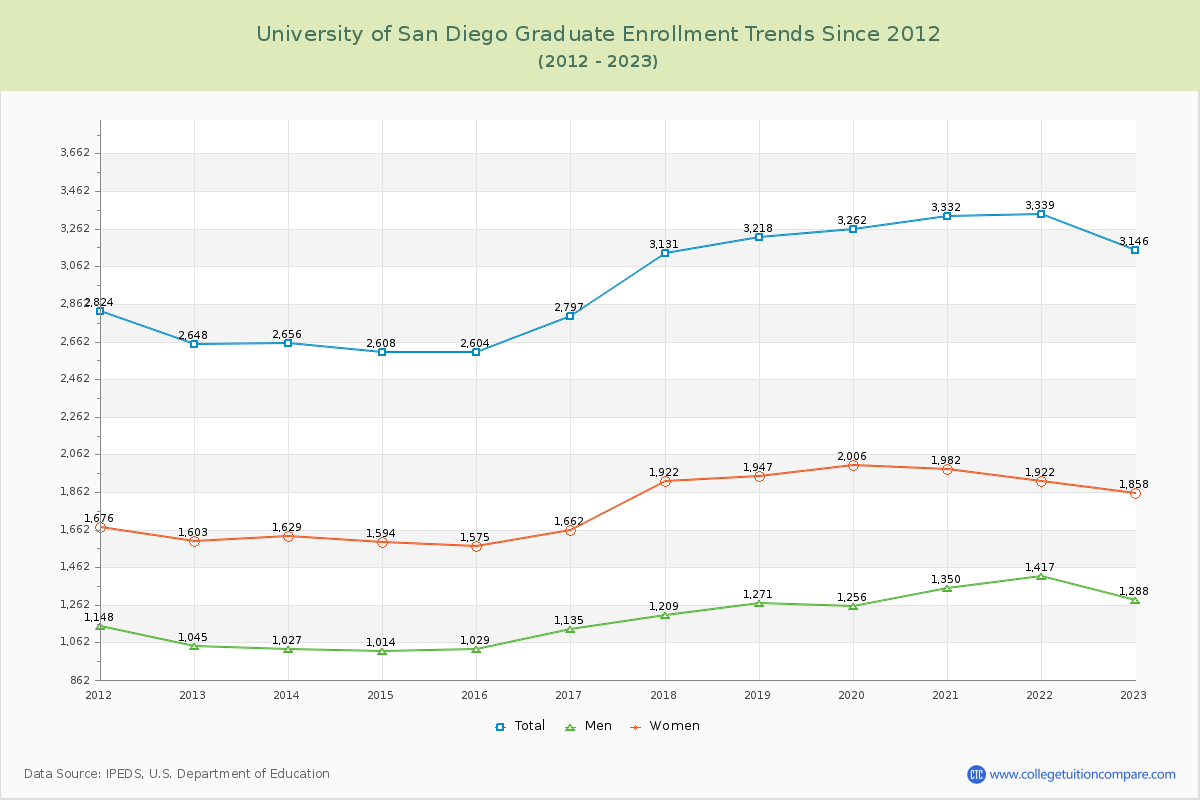
64.31% of total students is undergraduate students and 35.69% students is graduate students. The number of undergraduate students has increased by 212 and the graduate enrollment has increased by 498 over past 10 years.
The female to male ratio is 1.34 to 1 and it means that there are more female students enrolled in USD than male students.
The following table and chart illustrate the changes in student population by gender at University of San Diego since 2012.
| Year | Total | Undergraduate | Graduate | ||||
|---|---|---|---|---|---|---|---|
| Total | Men | Women | Total | Men | Women | ||
| 2012-13 | 8,105 | 5,457 | 2,440 | 3,017 | 2,648 | 1,045 | 1,603 |
| 2013-14 | 8,321 216 | 5,665 208 | 2,548 108 | 3,117 100 | 2,656 8 | 1,027 -18 | 1,629 26 |
| 2014-15 | 8,349 28 | 5,741 76 | 2,574 26 | 3,167 50 | 2,608 -48 | 1,014 -13 | 1,594 -35 |
| 2015-16 | 8,251 -98 | 5,647 -94 | 2,573 -1 | 3,074 -93 | 2,604 -4 | 1,029 15 | 1,575 -19 |
| 2016-17 | 8,508 257 | 5,711 64 | 2,627 54 | 3,084 10 | 2,797 193 | 1,135 106 | 1,662 87 |
| 2017-18 | 8,905 397 | 5,774 63 | 2,633 6 | 3,141 57 | 3,131 334 | 1,209 74 | 1,922 260 |
| 2018-19 | 9,073 168 | 5,855 81 | 2,646 13 | 3,209 68 | 3,218 87 | 1,271 62 | 1,947 25 |
| 2019-20 | 9,181 108 | 5,919 64 | 2,629 -17 | 3,290 81 | 3,262 44 | 1,256 -15 | 2,006 59 |
| 2020-21 | 8,861 -320 | 5,529 -390 | 2,370 -259 | 3,159 -131 | 3,332 70 | 1,350 94 | 1,982 -24 |
| 2021-22 | 9,041 180 | 5,702 173 | 2,501 131 | 3,201 42 | 3,339 7 | 1,417 67 | 1,922 -60 |
| 2022-23 | 8,815 -226 | 5,669 -33 | 2,481 -20 | 3,188 -13 | 3,146 -193 | 1,288 -129 | 1,858 -64 |
| Average | 8,674 | 5,697 | 2,547 | 3,150 | 2,976 | 1,186 | 1,791 |