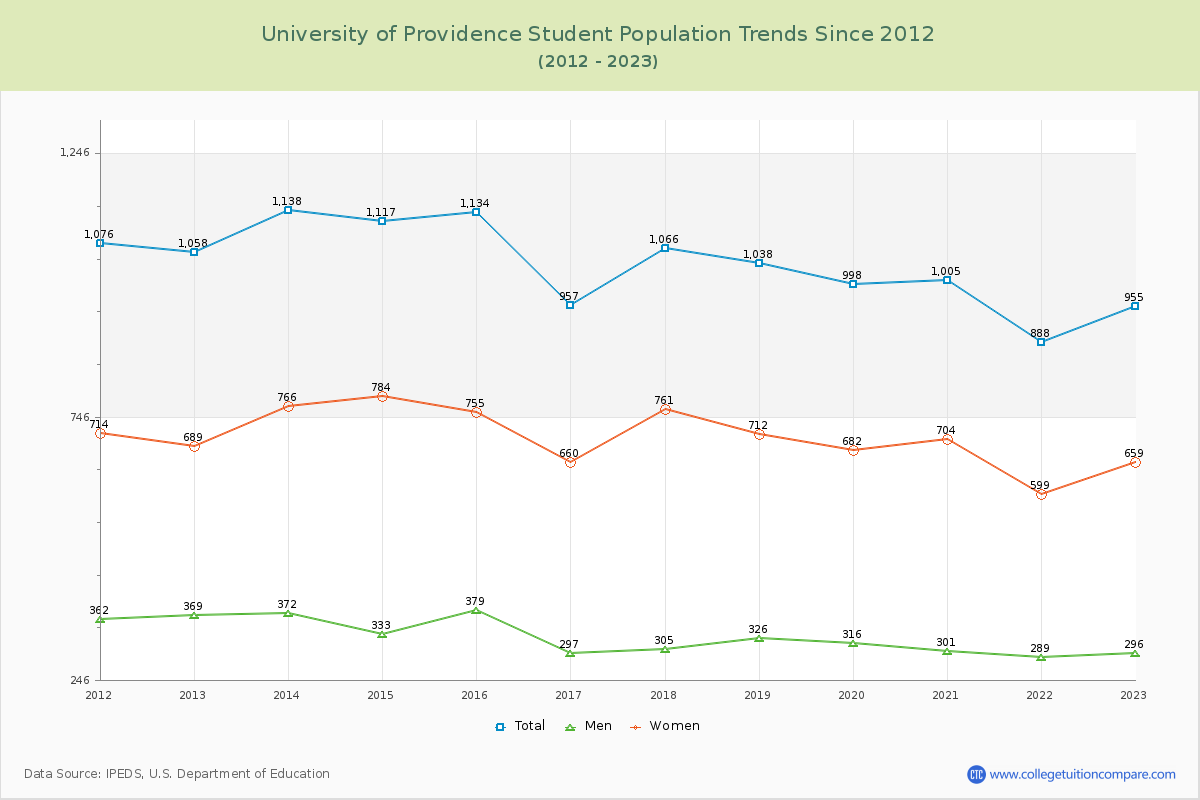
Student Population Changes
The average student population over the last 12 years is 1,032 where 955 students are attending the school for the academic year 2022-2023.
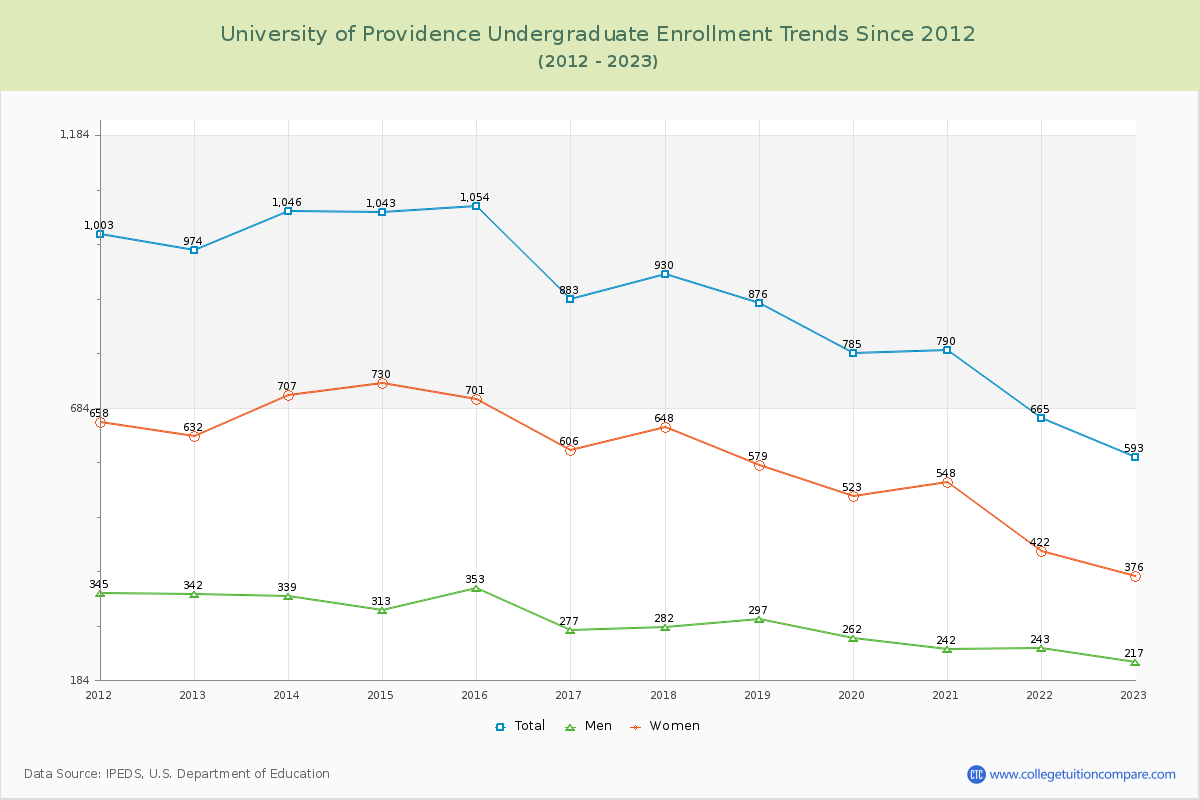
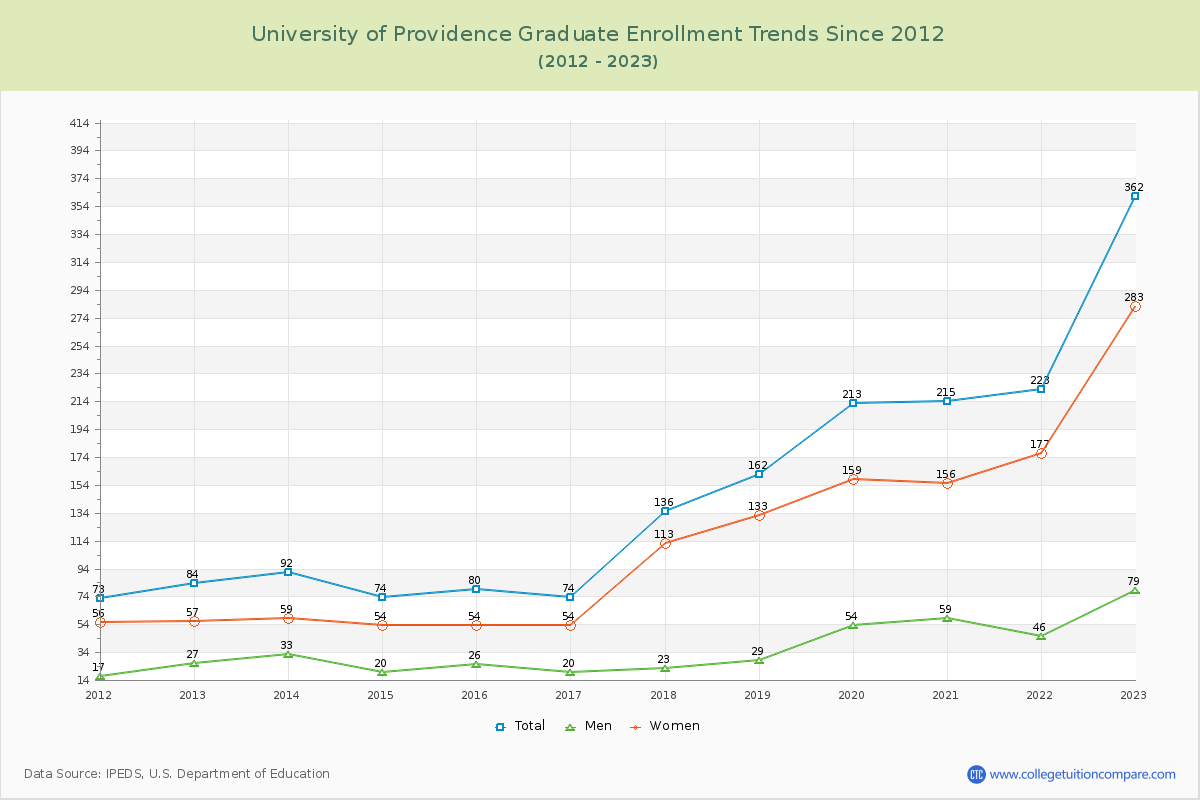
62.09% of total students is undergraduate students and 37.91% students is graduate students. The number of undergraduate students has decreased by 381 and the graduate enrollment has increased by 278 over past 10 years.
The female to male ratio is 2.23 to 1 and it means that there are far more female students enrolled in U of Providence than male students.
The following table and chart illustrate the changes in student population by gender at University of Providence since 2012.
| Year | Total | Undergraduate | Graduate | ||||
|---|---|---|---|---|---|---|---|
| Total | Men | Women | Total | Men | Women | ||
| 2012-13 | 1,058 | 974 | 342 | 632 | 84 | 27 | 57 |
| 2013-14 | 1,138 80 | 1,046 72 | 339 -3 | 707 75 | 92 8 | 33 6 | 59 2 |
| 2014-15 | 1,117 -21 | 1,043 -3 | 313 -26 | 730 23 | 74 -18 | 20 -13 | 54 -5 |
| 2015-16 | 1,134 17 | 1,054 11 | 353 40 | 701 -29 | 80 6 | 26 6 | 54 0 |
| 2016-17 | 957 -177 | 883 -171 | 277 -76 | 606 -95 | 74 -6 | 20 -6 | 54 0 |
| 2017-18 | 1,066 109 | 930 47 | 282 5 | 648 42 | 136 62 | 23 3 | 113 59 |
| 2018-19 | 1,038 -28 | 876 -54 | 297 15 | 579 -69 | 162 26 | 29 6 | 133 20 |
| 2019-20 | 998 -40 | 785 -91 | 262 -35 | 523 -56 | 213 51 | 54 25 | 159 26 |
| 2020-21 | 1,005 7 | 790 5 | 242 -20 | 548 25 | 215 2 | 59 5 | 156 -3 |
| 2021-22 | 888 -117 | 665 -125 | 243 1 | 422 -126 | 223 8 | 46 -13 | 177 21 |
| 2022-23 | 955 67 | 593 -72 | 217 -26 | 376 -46 | 362 139 | 79 33 | 283 106 |
| Average | 1,032 | 876 | 288 | 588 | 156 | 38 | 118 |