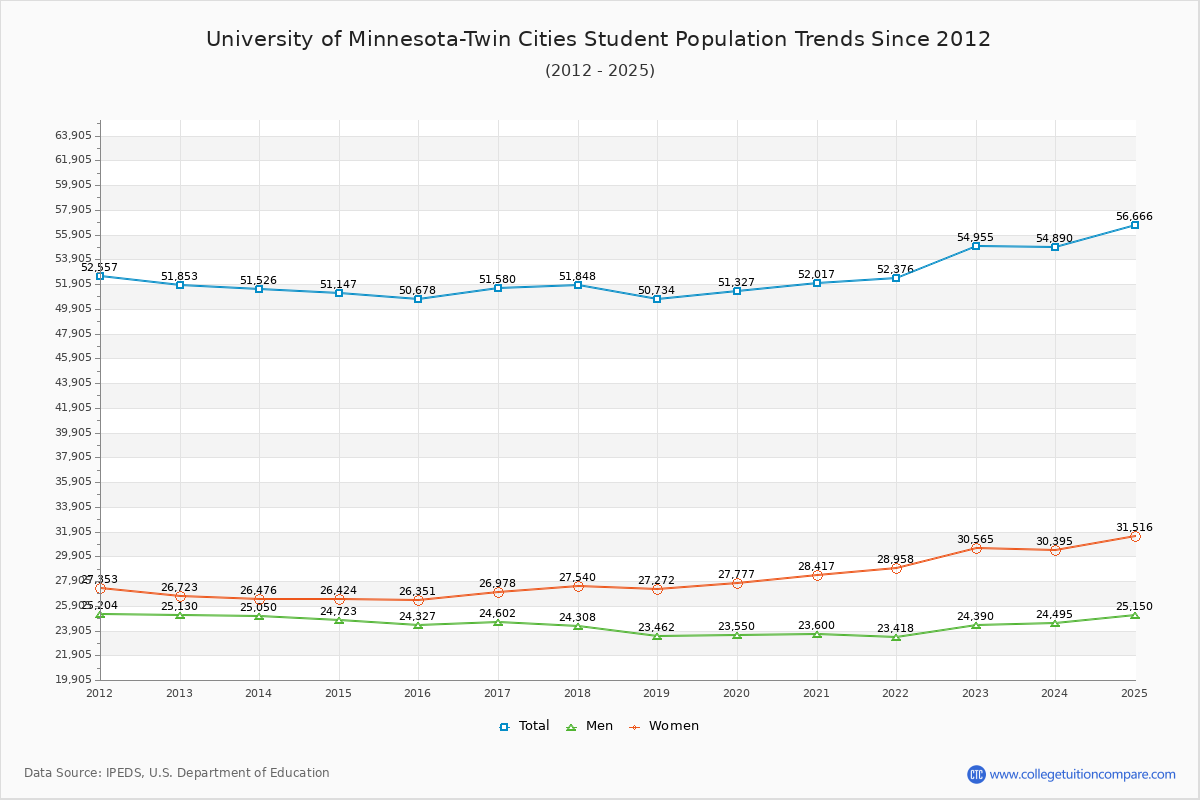
Student Population Changes
The average student population over the last 12 years is 51,822 where 54,955 students are attending the school for the academic year 2022-2023.
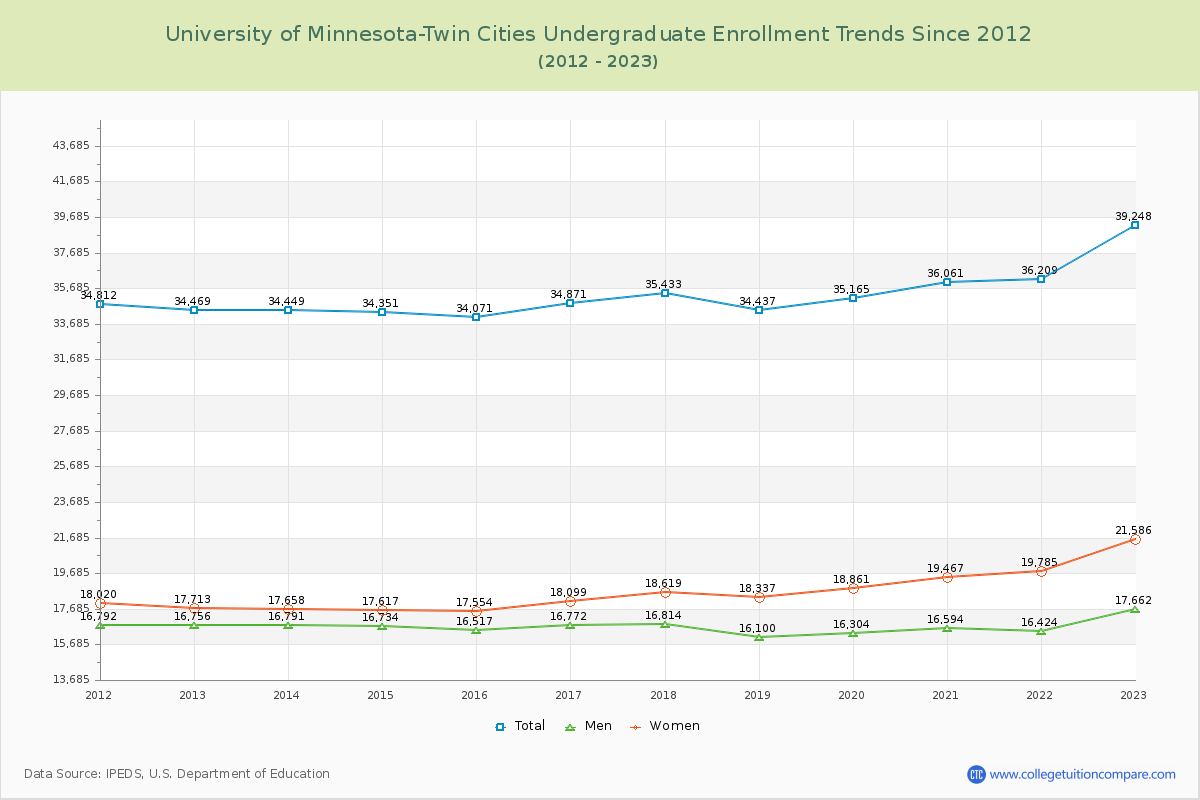
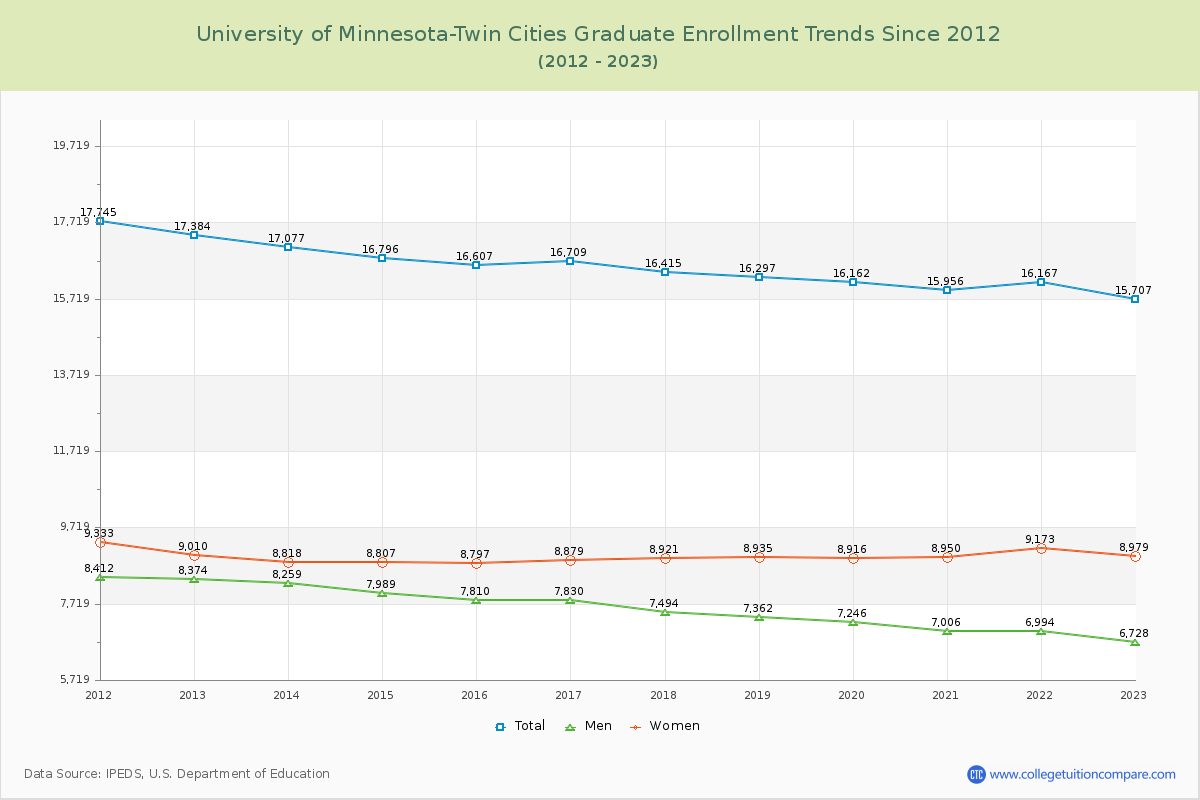
71.42% of total students is undergraduate students and 28.58% students is graduate students. The number of undergraduate students has increased by 4,779 and the graduate enrollment has decreased by 1,677 over past 10 years.
The female to male ratio is 1.25 to 1 and it means that there are slightly more female students enrolled in UMTC than male students.
The following table and chart illustrate the changes in student population by gender at University of Minnesota-Twin Cities since 2012.
| Year | Total | Undergraduate | Graduate | ||||
|---|---|---|---|---|---|---|---|
| Total | Men | Women | Total | Men | Women | ||
| 2012-13 | 51,853 | 34,469 | 16,756 | 17,713 | 17,384 | 8,374 | 9,010 |
| 2013-14 | 51,526 -327 | 34,449 -20 | 16,791 35 | 17,658 -55 | 17,077 -307 | 8,259 -115 | 8,818 -192 |
| 2014-15 | 51,147 -379 | 34,351 -98 | 16,734 -57 | 17,617 -41 | 16,796 -281 | 7,989 -270 | 8,807 -11 |
| 2015-16 | 50,678 -469 | 34,071 -280 | 16,517 -217 | 17,554 -63 | 16,607 -189 | 7,810 -179 | 8,797 -10 |
| 2016-17 | 51,580 902 | 34,871 800 | 16,772 255 | 18,099 545 | 16,709 102 | 7,830 20 | 8,879 82 |
| 2017-18 | 51,848 268 | 35,433 562 | 16,814 42 | 18,619 520 | 16,415 -294 | 7,494 -336 | 8,921 42 |
| 2018-19 | 50,734 -1,114 | 34,437 -996 | 16,100 -714 | 18,337 -282 | 16,297 -118 | 7,362 -132 | 8,935 14 |
| 2019-20 | 51,327 593 | 35,165 728 | 16,304 204 | 18,861 524 | 16,162 -135 | 7,246 -116 | 8,916 -19 |
| 2020-21 | 52,017 690 | 36,061 896 | 16,594 290 | 19,467 606 | 15,956 -206 | 7,006 -240 | 8,950 34 |
| 2021-22 | 52,376 359 | 36,209 148 | 16,424 -170 | 19,785 318 | 16,167 211 | 6,994 -12 | 9,173 223 |
| 2022-23 | 54,955 2,579 | 39,248 3,039 | 17,662 1,238 | 21,586 1,801 | 15,707 -460 | 6,728 -266 | 8,979 -194 |
| Average | 51,822 | 35,342 | 16,679 | 18,663 | 16,480 | 7,554 | 8,926 |