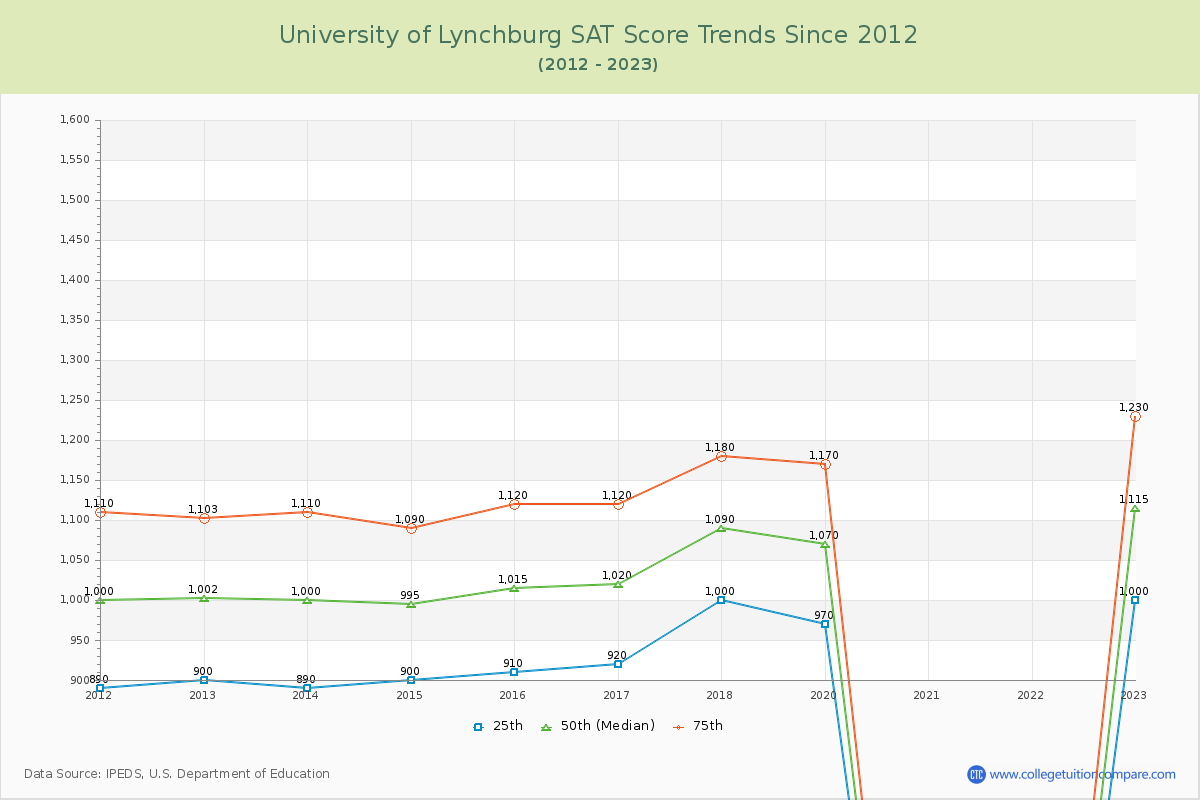
SAT Scores Over Time
The 2023 SAT score is 1115 at U of Lynchburg. Over the past 12 years, the average SAT score is 936 (25th percentile) and 1140 (75th percentile). Compared to similar schools, the submitted SAT scores are around national average at U of Lynchburg.
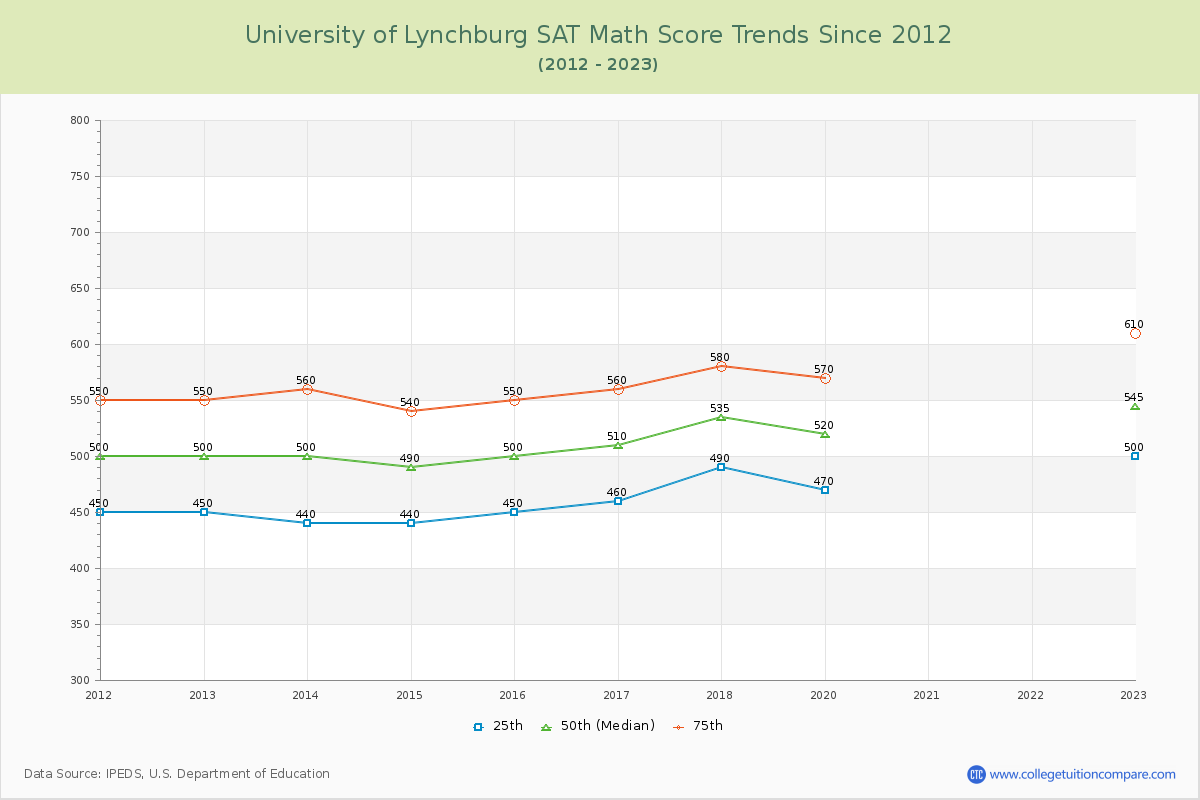
The following table and chart illustrate the changes in SAT scores at University of Lynchburg since 2012.
| Year | Total | Math | Evidence-Based Reading and Writing | ||||||
|---|---|---|---|---|---|---|---|---|---|
| 25th | 50th | 75th | 25th | 50th | 75th | 25th | 50th | 75th | |
| 2012-13 | 900 | 1,002 | 1,103 | 450 | 500 | 550 | 450 | 502 | 553 |
| 2013-14 | 890 | 1,000 | 1,110 | 440 | 500 | 560 | 450 | 500 | 550 |
| 2014-15 | 900 | 995 | 1,090 | 440 | 490 | 540 | 460 | 505 | 550 |
| 2015-16 | 910 | 1,015 | 1,120 | 450 | 500 | 550 | 460 | 515 | 570 |
| 2016-17 | 920 | 1,020 | 1,120 | 460 | 510 | 560 | 460 | 510 | 560 |
| 2017-18 | 1,000 | 1,090 | 1,180 | 490 | 535 | 580 | 510 | 555 | 600 |
| 2018-19 | - | - | - | - | - | - | - | - | - |
| 2019-20 | 970 | 1,070 | 1,170 | 470 | 520 | 570 | 500 | 550 | 600 |
| 2020-21 | - | - | - | - | - | - | - | - | - |
| 2021-22 | - | - | - | - | - | - | - | - | - |
| 2022-23 | 1,000 | 1,115 | 1,230 | 500 | 545 | 610 | 500 | 570 | 620 |
| Average | 936 | 1038 | 1140 | 463 | 513 | 565 | 474 | 526 | 575 |
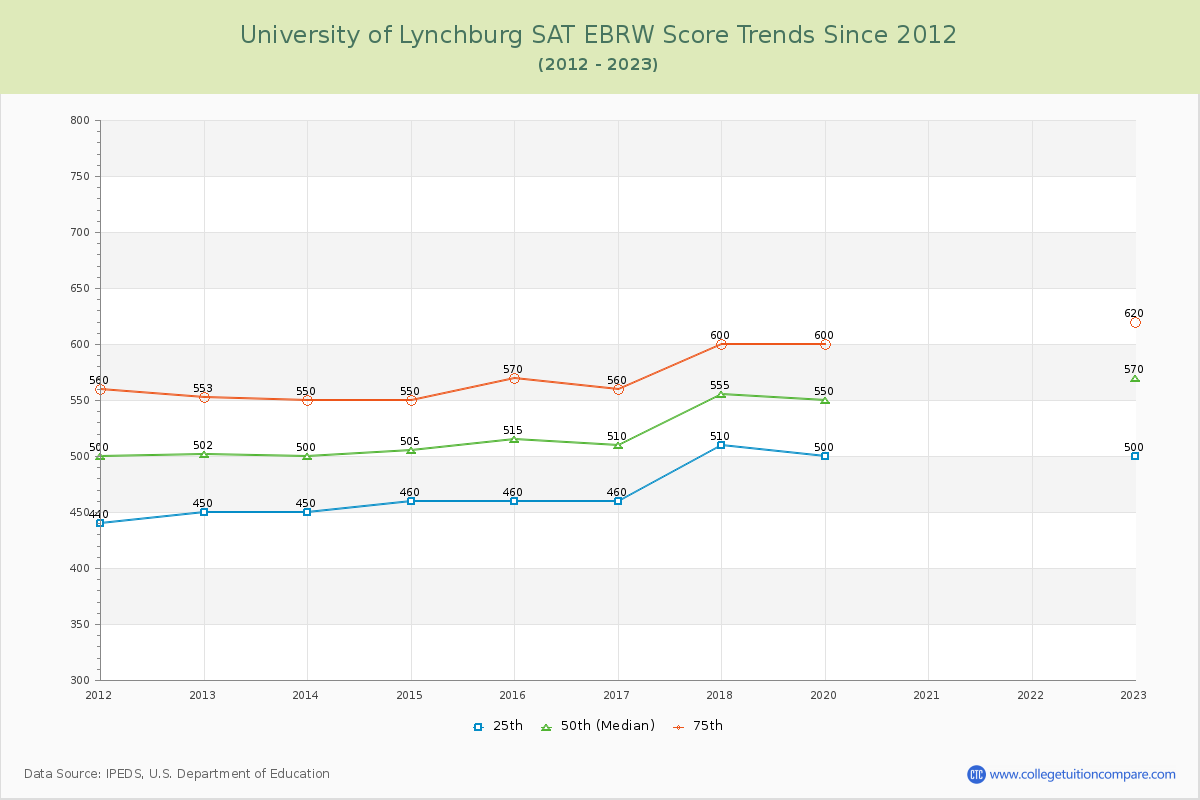
*SAT Evidence-Based Reading and Writing replaces SAT critical reading and writing since year 2017.
**The SAT Writing score is excluded from the total scores for year from 2011 to 2016.