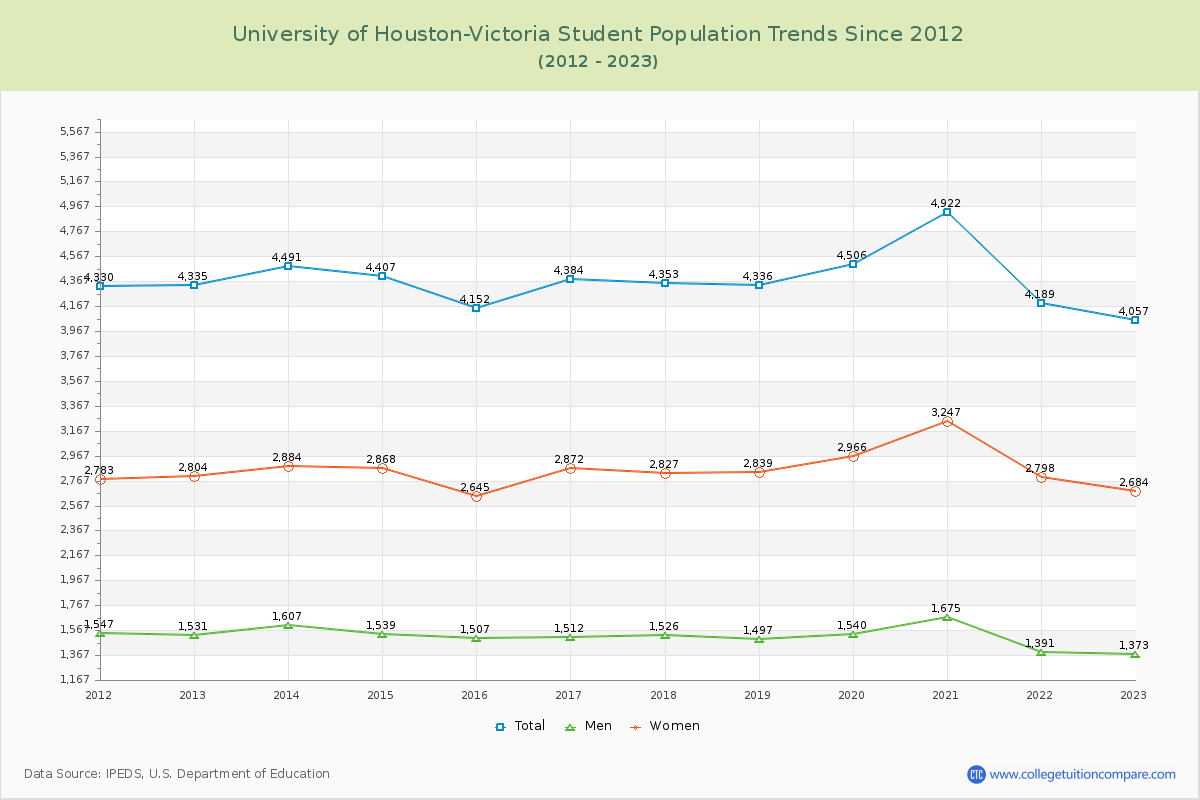
Student Population Changes
The average student population over the last 12 years is 4,376 where 4,057 students are attending the school for the academic year 2022-2023.
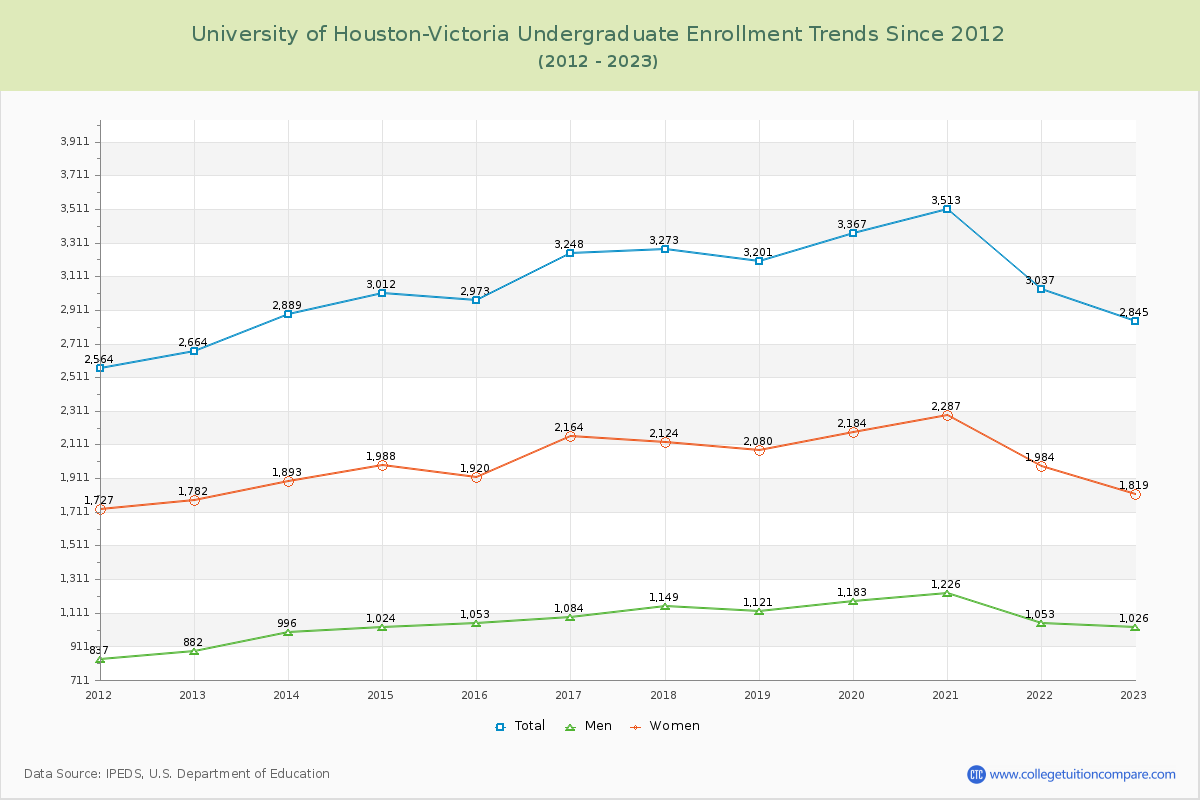
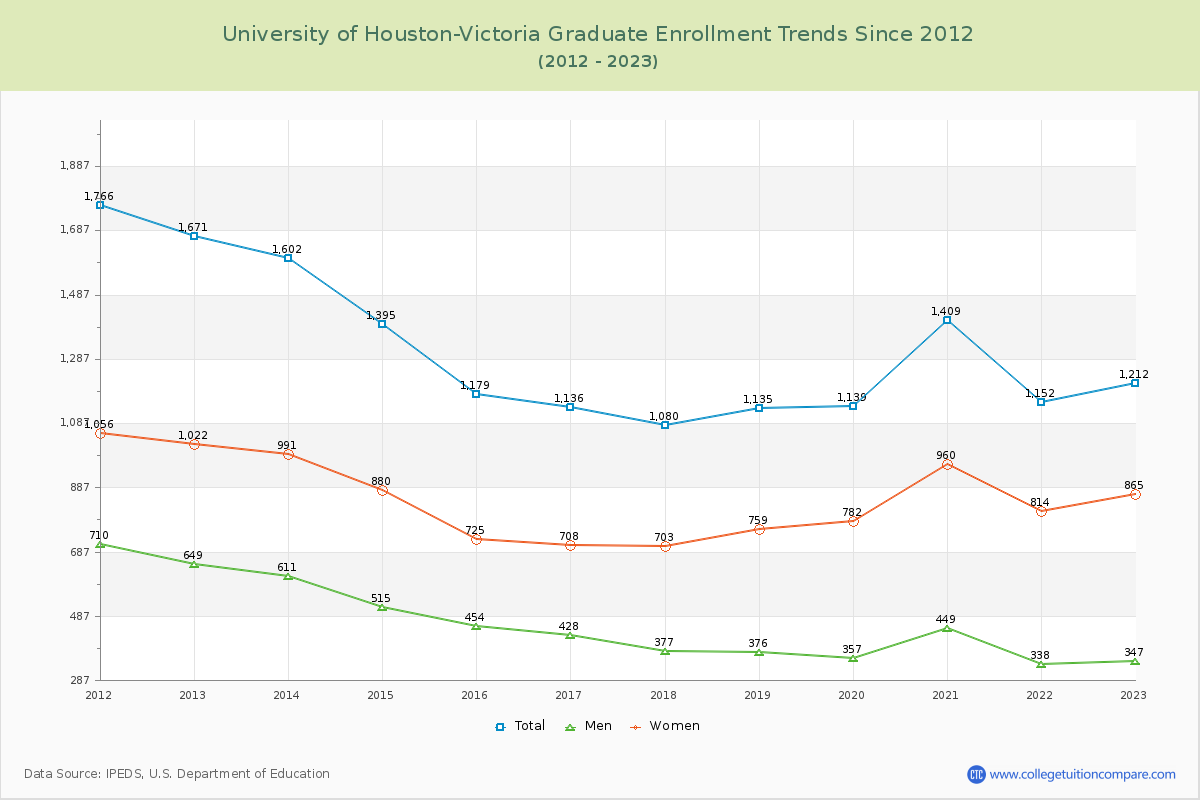
70.13% of total students is undergraduate students and 29.87% students is graduate students. The number of undergraduate students has increased by 181 and the graduate enrollment has decreased by 459 over past 10 years.
The female to male ratio is 1.95 to 1 and it means that there are more female students enrolled in U of Houston-Victoria than male students.
The following table and chart illustrate the changes in student population by gender at University of Houston-Victoria since 2012.
| Year | Total | Undergraduate | Graduate | ||||
|---|---|---|---|---|---|---|---|
| Total | Men | Women | Total | Men | Women | ||
| 2012-13 | 4,335 | 2,664 | 882 | 1,782 | 1,671 | 649 | 1,022 |
| 2013-14 | 4,491 156 | 2,889 225 | 996 114 | 1,893 111 | 1,602 -69 | 611 -38 | 991 -31 |
| 2014-15 | 4,407 -84 | 3,012 123 | 1,024 28 | 1,988 95 | 1,395 -207 | 515 -96 | 880 -111 |
| 2015-16 | 4,152 -255 | 2,973 -39 | 1,053 29 | 1,920 -68 | 1,179 -216 | 454 -61 | 725 -155 |
| 2016-17 | 4,384 232 | 3,248 275 | 1,084 31 | 2,164 244 | 1,136 -43 | 428 -26 | 708 -17 |
| 2017-18 | 4,353 -31 | 3,273 25 | 1,149 65 | 2,124 -40 | 1,080 -56 | 377 -51 | 703 -5 |
| 2018-19 | 4,336 -17 | 3,201 -72 | 1,121 -28 | 2,080 -44 | 1,135 55 | 376 -1 | 759 56 |
| 2019-20 | 4,506 170 | 3,367 166 | 1,183 62 | 2,184 104 | 1,139 4 | 357 -19 | 782 23 |
| 2020-21 | 4,922 416 | 3,513 146 | 1,226 43 | 2,287 103 | 1,409 270 | 449 92 | 960 178 |
| 2021-22 | 4,189 -733 | 3,037 -476 | 1,053 -173 | 1,984 -303 | 1,152 -257 | 338 -111 | 814 -146 |
| 2022-23 | 4,057 -132 | 2,845 -192 | 1,026 -27 | 1,819 -165 | 1,212 60 | 347 9 | 865 51 |
| Average | 4,376 | 3,093 | 1,072 | 2,020 | 1,283 | 446 | 837 |