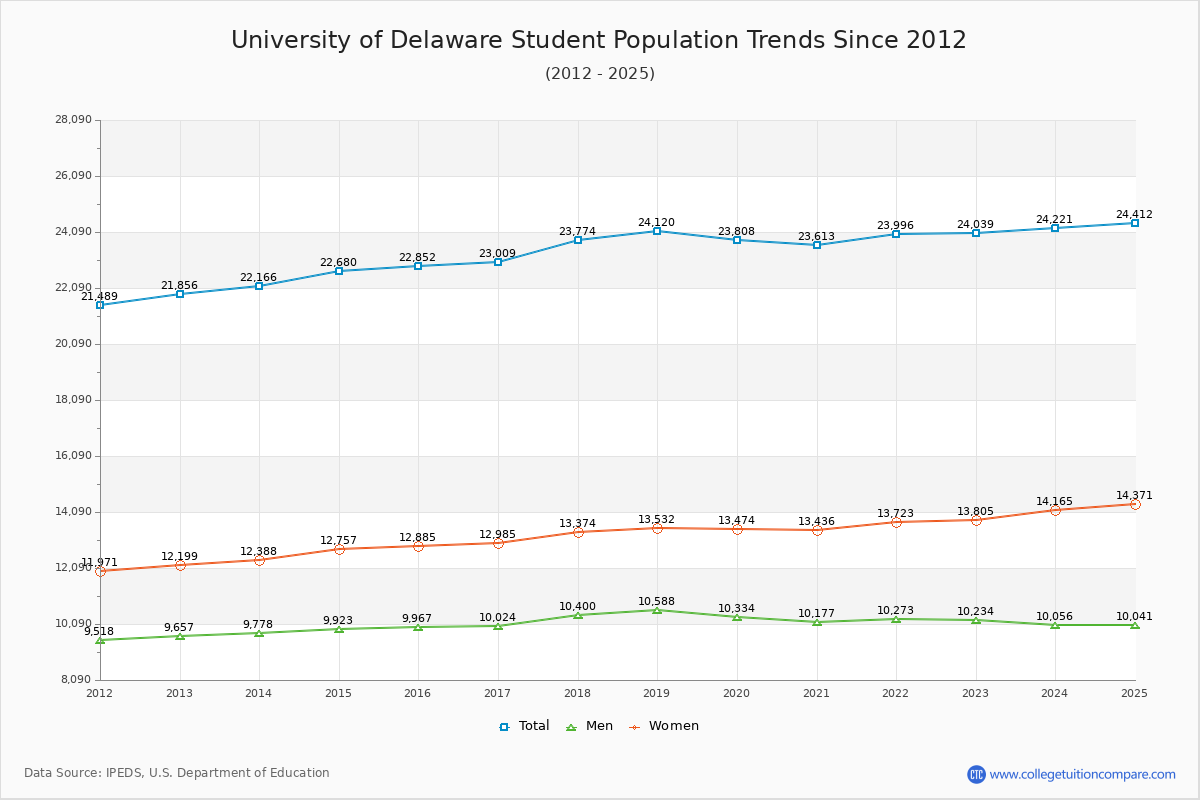
Student Population Changes
The average student population over the last 12 years is 23,265 where 24,039 students are attending the school for the academic year 2022-2023.
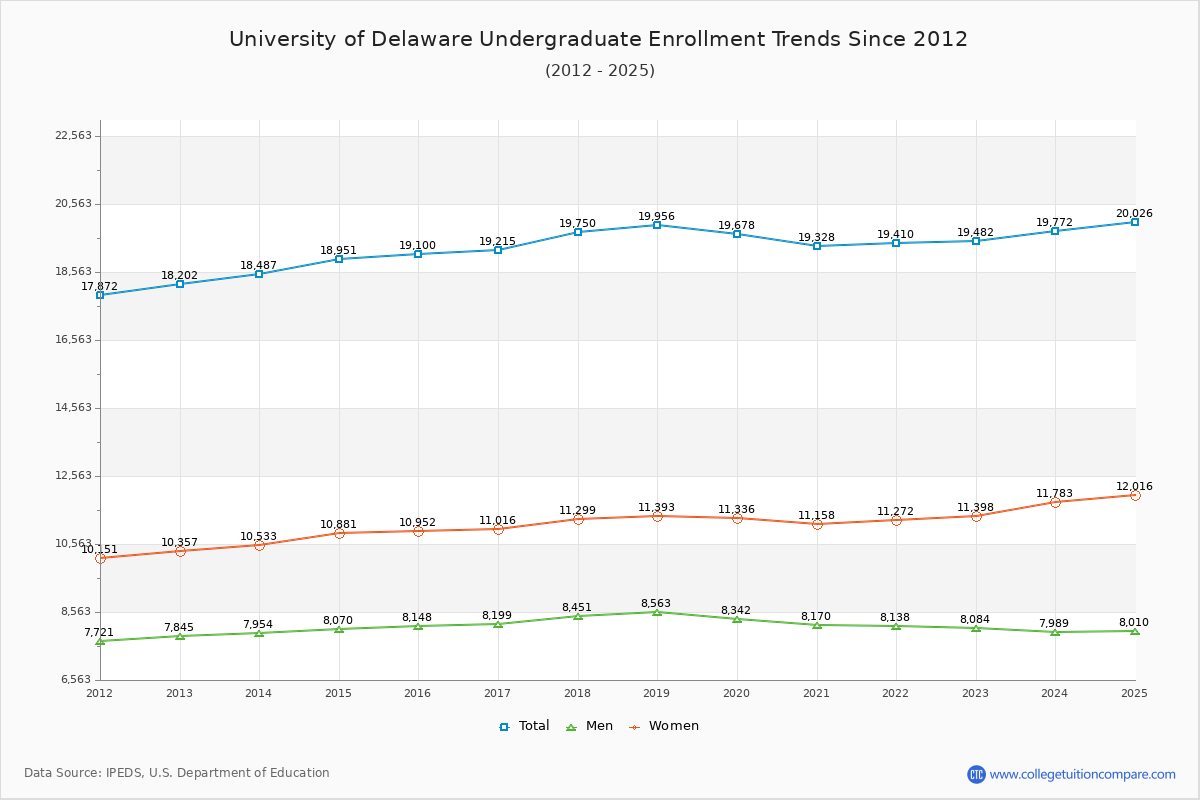
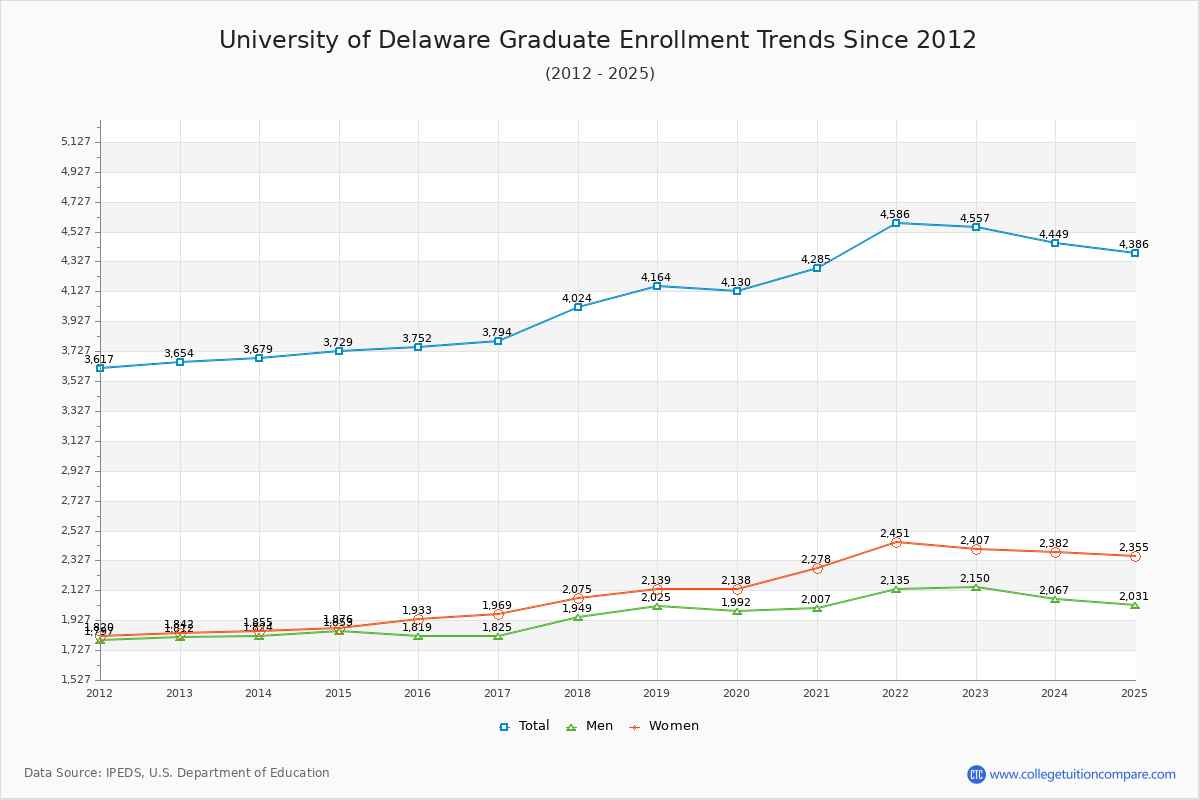
81.04% of total students is undergraduate students and 18.96% students is graduate students. The number of undergraduate students has increased by 1,280 and the graduate enrollment has increased by 903 over past 10 years.
The female to male ratio is 1.35 to 1 and it means that there are more female students enrolled in UD than male students.
The following table and chart illustrate the changes in student population by gender at University of Delaware since 2012.
| Year | Total | Undergraduate | Graduate | ||||
|---|---|---|---|---|---|---|---|
| Total | Men | Women | Total | Men | Women | ||
| 2012-13 | 21,856 | 18,202 | 7,845 | 10,357 | 3,654 | 1,812 | 1,842 |
| 2013-14 | 22,166 310 | 18,487 285 | 7,954 109 | 10,533 176 | 3,679 25 | 1,824 12 | 1,855 13 |
| 2014-15 | 22,680 514 | 18,951 464 | 8,070 116 | 10,881 348 | 3,729 50 | 1,853 29 | 1,876 21 |
| 2015-16 | 22,852 172 | 19,100 149 | 8,148 78 | 10,952 71 | 3,752 23 | 1,819 -34 | 1,933 57 |
| 2016-17 | 23,009 157 | 19,215 115 | 8,199 51 | 11,016 64 | 3,794 42 | 1,825 6 | 1,969 36 |
| 2017-18 | 23,774 765 | 19,750 535 | 8,451 252 | 11,299 283 | 4,024 230 | 1,949 124 | 2,075 106 |
| 2018-19 | 24,120 346 | 19,956 206 | 8,563 112 | 11,393 94 | 4,164 140 | 2,025 76 | 2,139 64 |
| 2019-20 | 23,808 -312 | 19,678 -278 | 8,342 -221 | 11,336 -57 | 4,130 -34 | 1,992 -33 | 2,138 -1 |
| 2020-21 | 23,613 -195 | 19,328 -350 | 8,170 -172 | 11,158 -178 | 4,285 155 | 2,007 15 | 2,278 140 |
| 2021-22 | 23,996 383 | 19,410 82 | 8,138 -32 | 11,272 114 | 4,586 301 | 2,135 128 | 2,451 173 |
| 2022-23 | 24,039 43 | 19,482 72 | 8,084 -54 | 11,398 126 | 4,557 -29 | 2,150 15 | 2,407 -44 |
| Average | 23,265 | 19,233 | 8,179 | 11,054 | 4,032 | 1,945 | 2,088 |