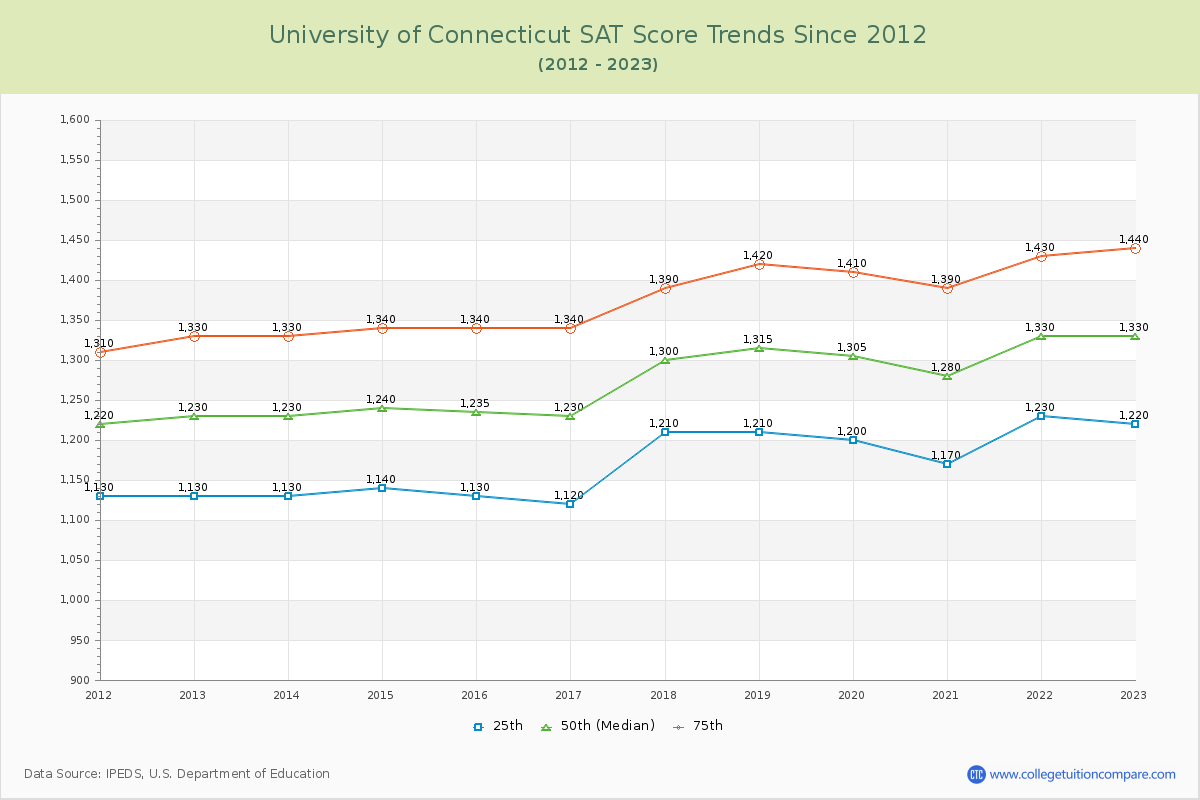
SAT Scores Over Time
The 2023 SAT score is 1330 at U of Connecticut. Over the past 12 years, the average SAT score is 1172 (25th percentile) and 1378 (75th percentile). Compared to similar schools, the submitted SAT scores are competitive and high at U of Connecticut.
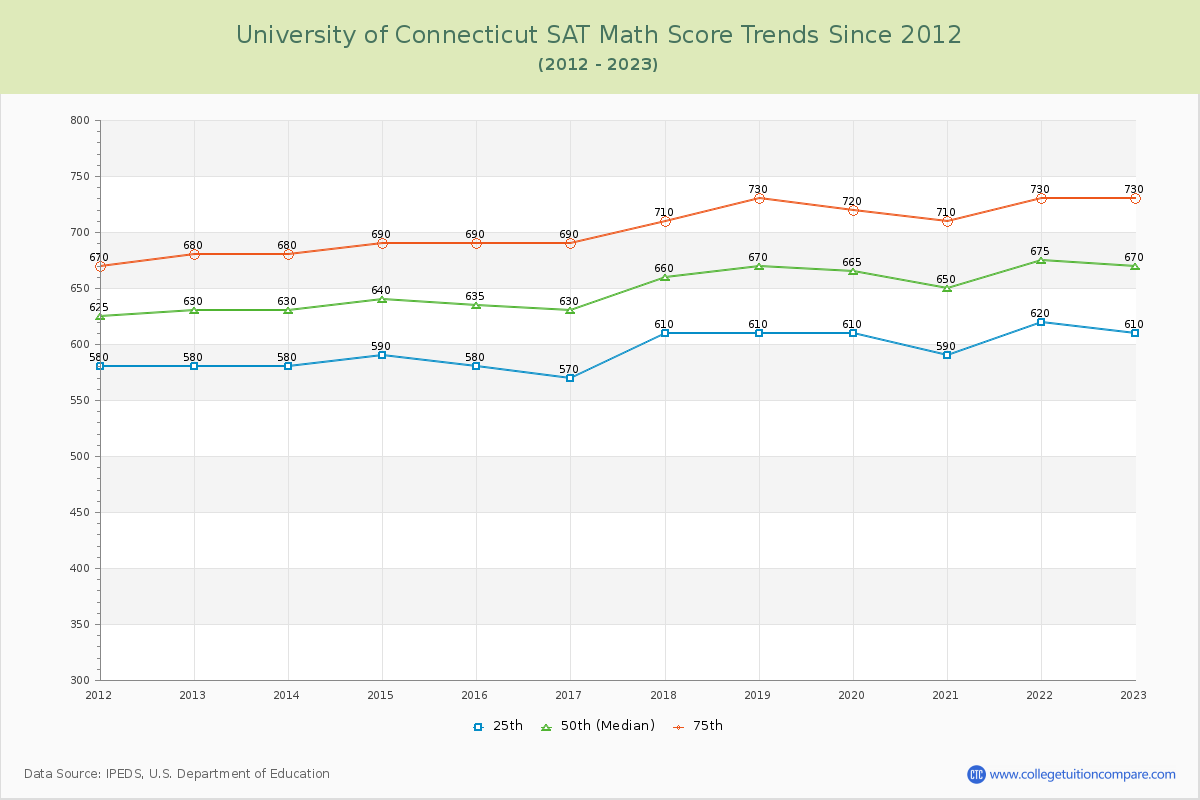
The following table and chart illustrate the changes in SAT scores at University of Connecticut since 2012.
| Year | Total | Math | Evidence-Based Reading and Writing | ||||||
|---|---|---|---|---|---|---|---|---|---|
| 25th | 50th | 75th | 25th | 50th | 75th | 25th | 50th | 75th | |
| 2012-13 | 1,130 | 1,230 | 1,330 | 580 | 630 | 680 | 550 | 600 | 650 |
| 2013-14 | 1,130 | 1,230 | 1,330 | 580 | 630 | 680 | 550 | 600 | 650 |
| 2014-15 | 1,140 | 1,240 | 1,340 | 590 | 640 | 690 | 550 | 600 | 650 |
| 2015-16 | 1,130 | 1,235 | 1,340 | 580 | 635 | 690 | 550 | 600 | 650 |
| 2016-17 | 1,120 | 1,230 | 1,340 | 570 | 630 | 690 | 550 | 600 | 650 |
| 2017-18 | 1,210 | 1,300 | 1,390 | 610 | 660 | 710 | 600 | 640 | 680 |
| 2018-19 | 1,210 | 1,315 | 1,420 | 610 | 670 | 730 | 600 | 645 | 690 |
| 2019-20 | 1,200 | 1,305 | 1,410 | 610 | 665 | 720 | 590 | 640 | 690 |
| 2020-21 | 1,170 | 1,280 | 1,390 | 590 | 650 | 710 | 580 | 630 | 680 |
| 2021-22 | 1,230 | 1,330 | 1,430 | 620 | 675 | 730 | 610 | 655 | 700 |
| 2022-23 | 1,220 | 1,330 | 1,440 | 610 | 670 | 730 | 610 | 660 | 710 |
| Average | 1172 | 1275 | 1378 | 595 | 650 | 705 | 576 | 625 | 673 |
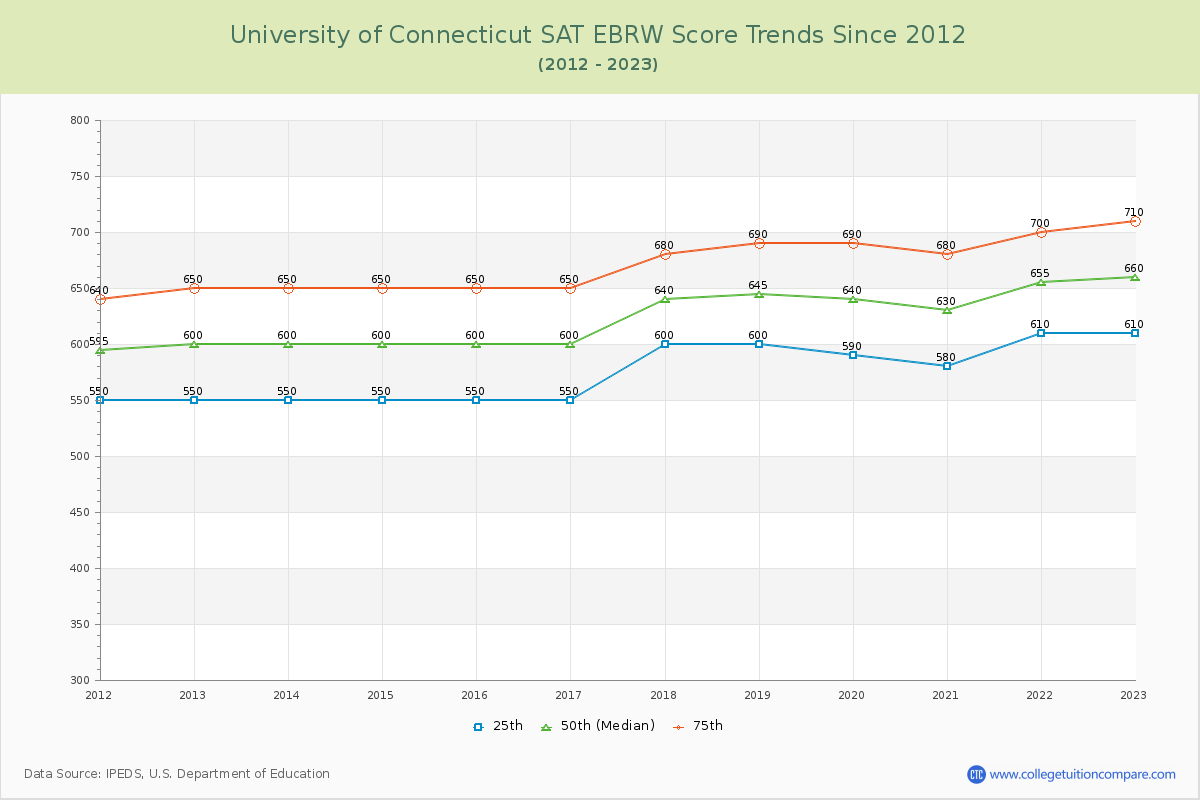
*SAT Evidence-Based Reading and Writing replaces SAT critical reading and writing since year 2017.
**The SAT Writing score is excluded from the total scores for year from 2011 to 2016.