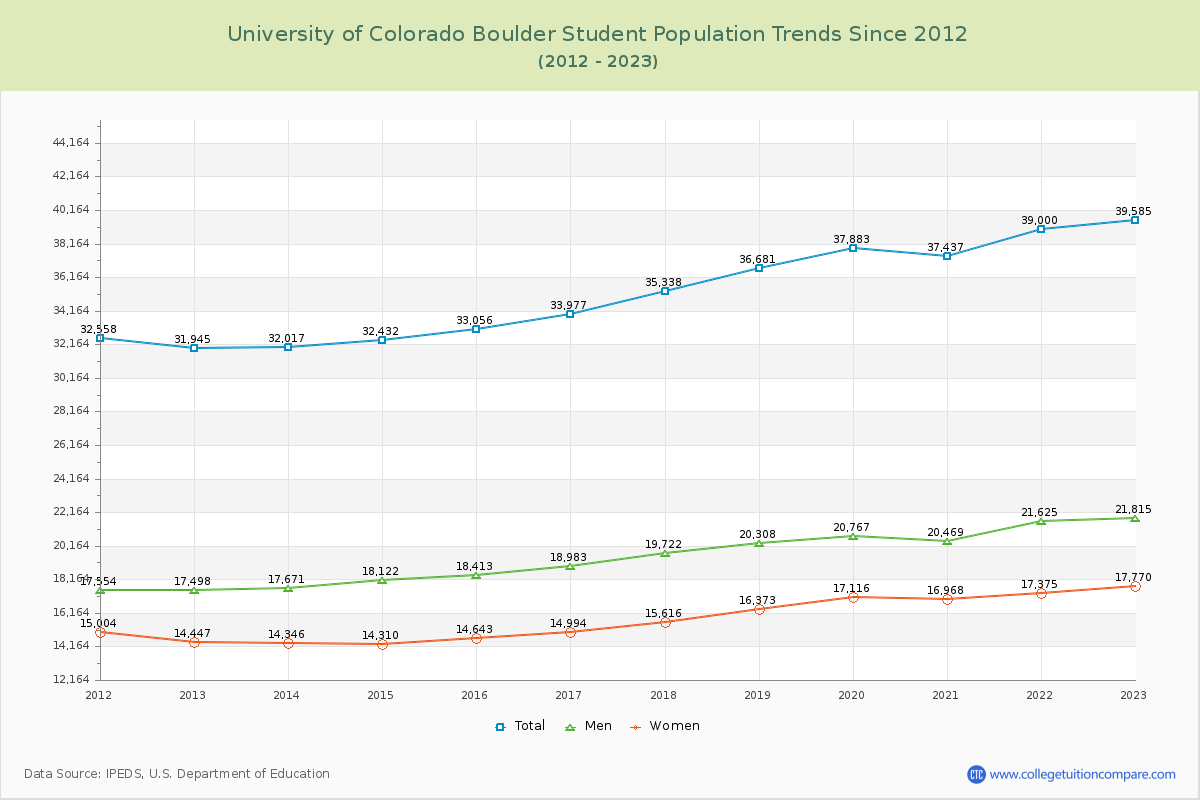
Student Population Changes
The average student population over the last 12 years is 35,396 where 39,585 students are attending the school for the academic year 2022-2023.
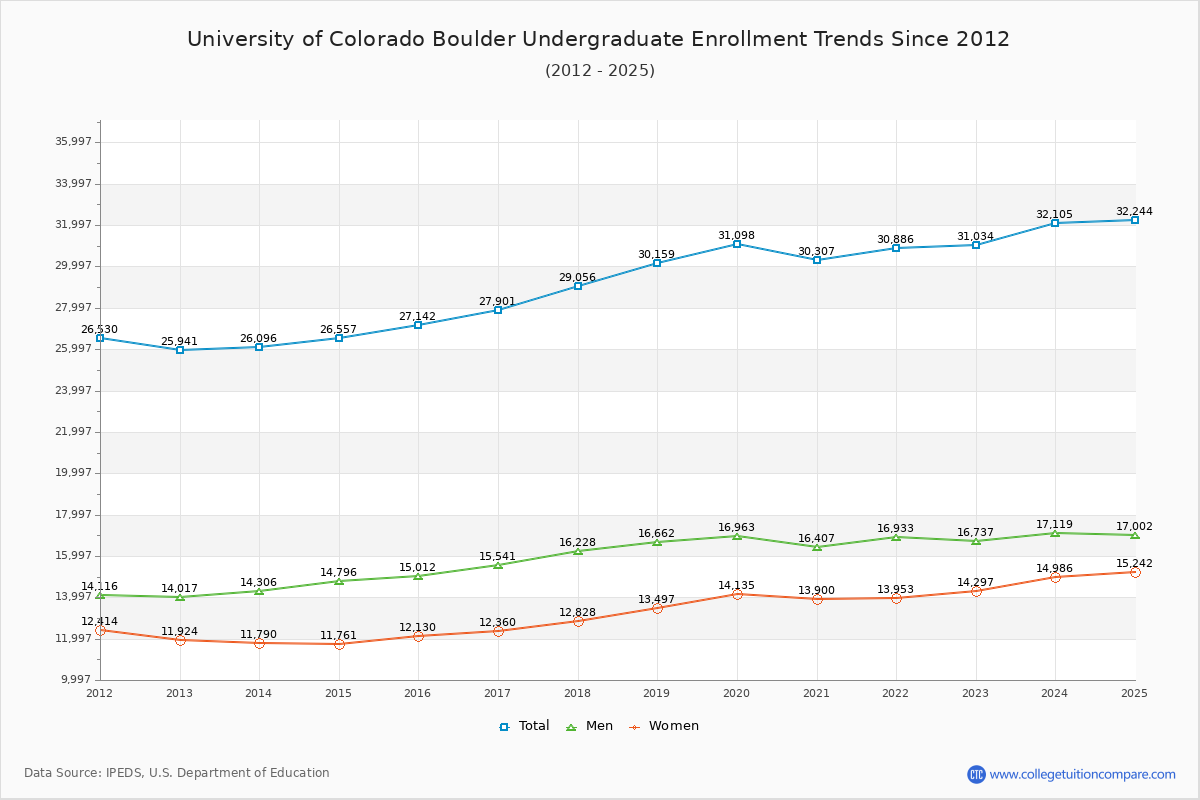
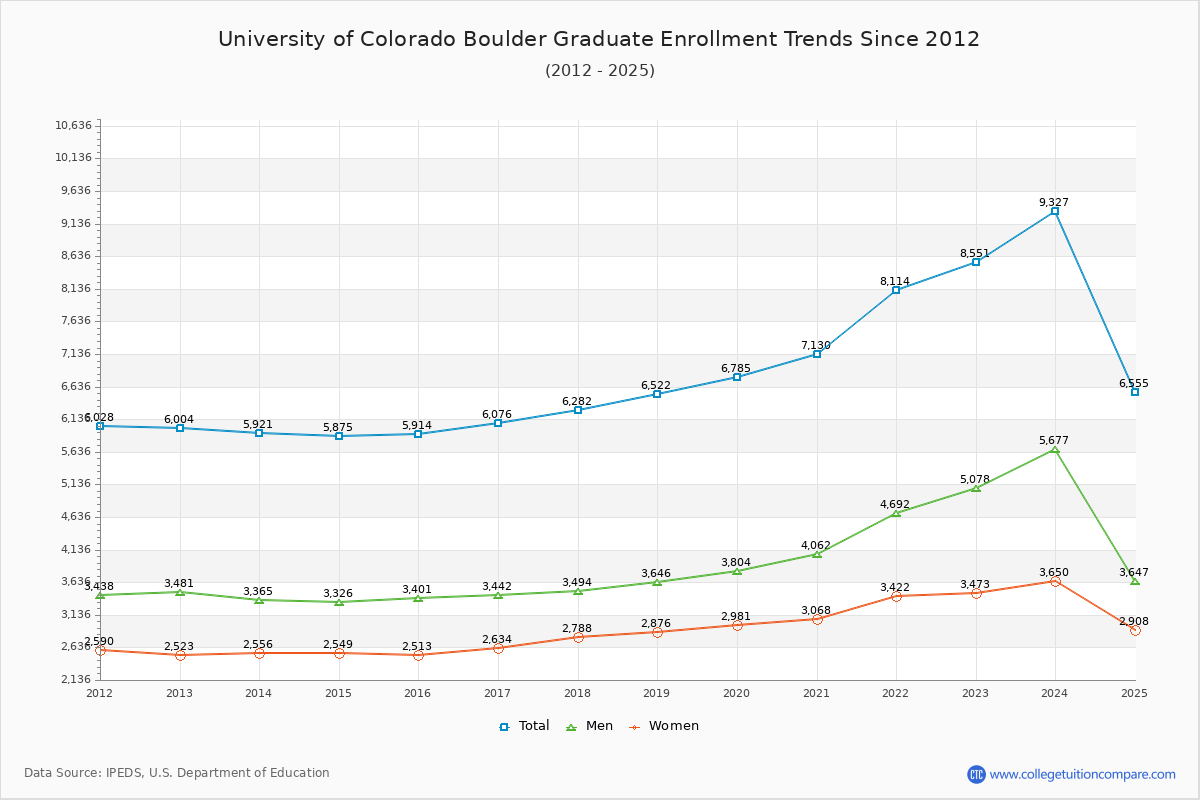
78.40% of total students is undergraduate students and 21.60% students is graduate students. The number of undergraduate students has increased by 5,093 and the graduate enrollment has increased by 2,547 over past 10 years.
The female to male ratio is 0.81 to 1 and it means that there are slightly more male students enrolled in CU Boulder than female students.
The following table and chart illustrate the changes in student population by gender at University of Colorado Boulder since 2012.
| Year | Total | Undergraduate | Graduate | ||||
|---|---|---|---|---|---|---|---|
| Total | Men | Women | Total | Men | Women | ||
| 2012-13 | 31,945 | 25,941 | 14,017 | 11,924 | 6,004 | 3,481 | 2,523 |
| 2013-14 | 32,017 72 | 26,096 155 | 14,306 289 | 11,790 -134 | 5,921 -83 | 3,365 -116 | 2,556 33 |
| 2014-15 | 32,432 415 | 26,557 461 | 14,796 490 | 11,761 -29 | 5,875 -46 | 3,326 -39 | 2,549 -7 |
| 2015-16 | 33,056 624 | 27,142 585 | 15,012 216 | 12,130 369 | 5,914 39 | 3,401 75 | 2,513 -36 |
| 2016-17 | 33,977 921 | 27,901 759 | 15,541 529 | 12,360 230 | 6,076 162 | 3,442 41 | 2,634 121 |
| 2017-18 | 35,338 1,361 | 29,056 1,155 | 16,228 687 | 12,828 468 | 6,282 206 | 3,494 52 | 2,788 154 |
| 2018-19 | 36,681 1,343 | 30,159 1,103 | 16,662 434 | 13,497 669 | 6,522 240 | 3,646 152 | 2,876 88 |
| 2019-20 | 37,883 1,202 | 31,098 939 | 16,963 301 | 14,135 638 | 6,785 263 | 3,804 158 | 2,981 105 |
| 2020-21 | 37,437 -446 | 30,307 -791 | 16,407 -556 | 13,900 -235 | 7,130 345 | 4,062 258 | 3,068 87 |
| 2021-22 | 39,000 1,563 | 30,886 579 | 16,933 526 | 13,953 53 | 8,114 984 | 4,692 630 | 3,422 354 |
| 2022-23 | 39,585 585 | 31,034 148 | 16,737 -196 | 14,297 344 | 8,551 437 | 5,078 386 | 3,473 51 |
| Average | 35,396 | 28,743 | 15,782 | 12,961 | 6,652 | 3,799 | 2,853 |