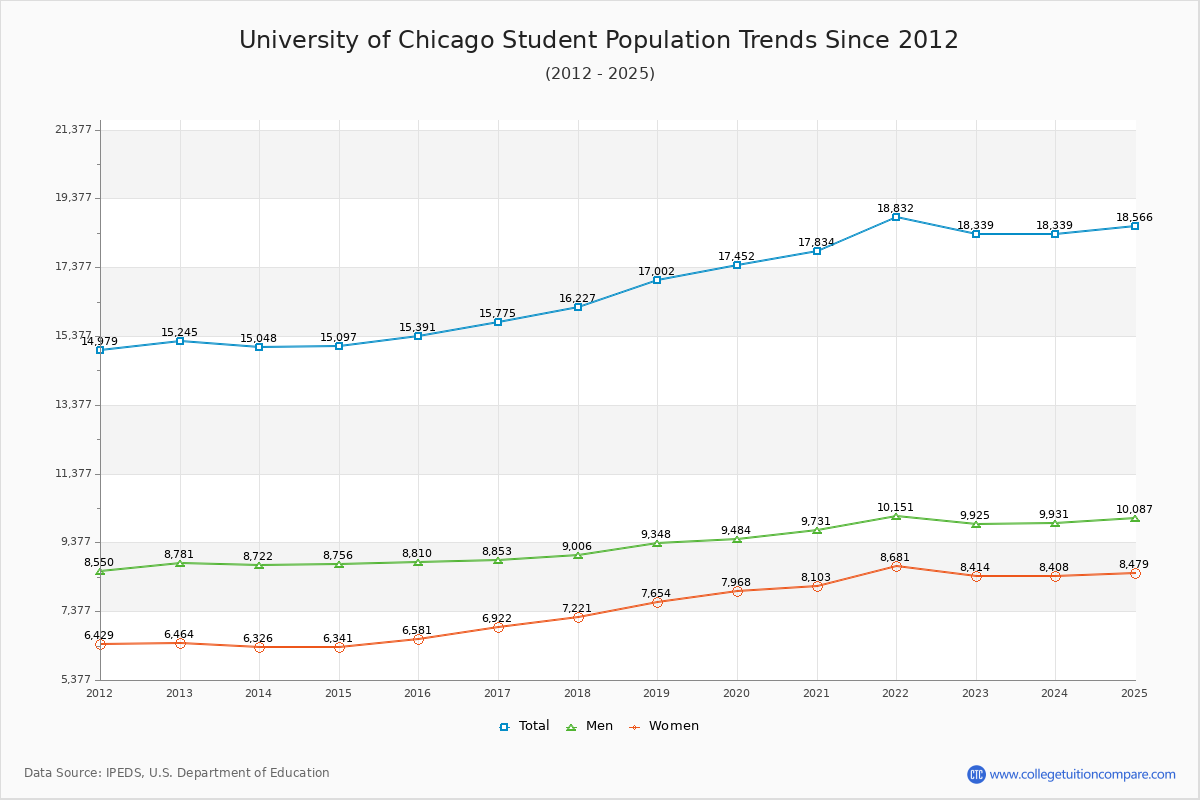
Student Population Changes
The average student population over the last 12 years is 16,567 where 18,339 students are attending the school for the academic year 2022-2023.
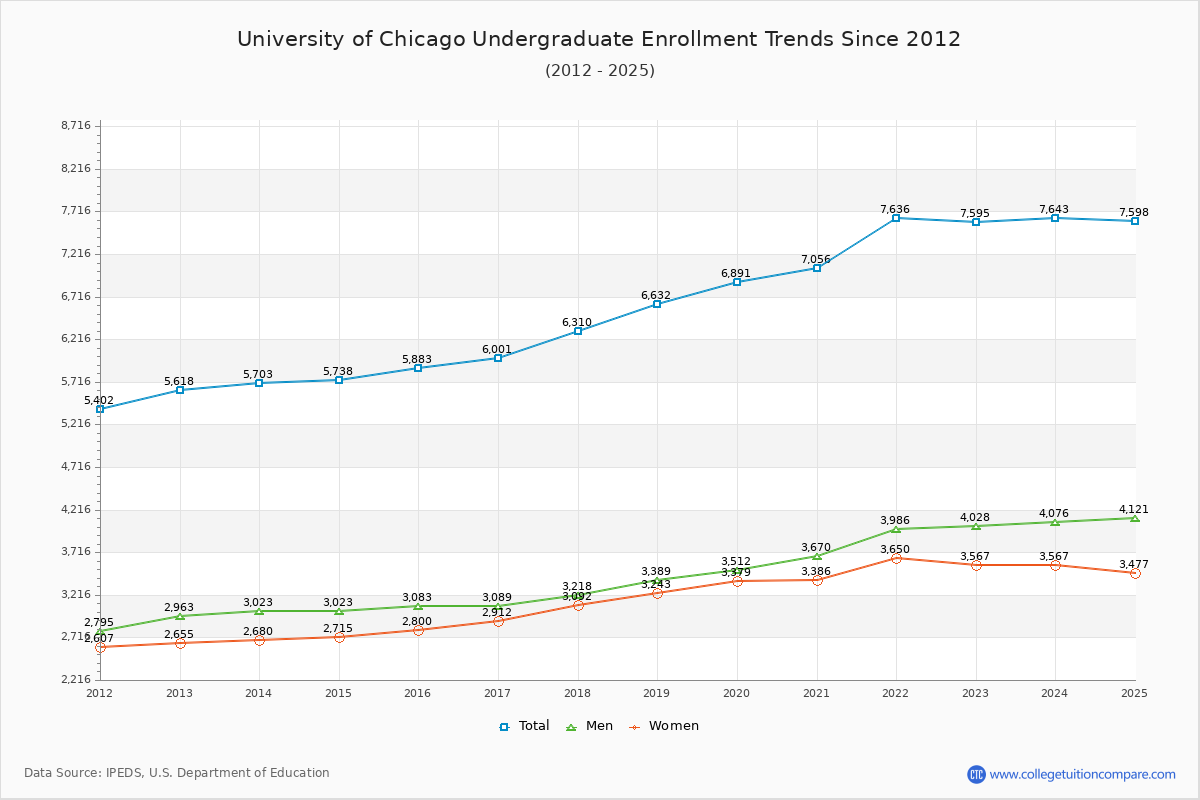
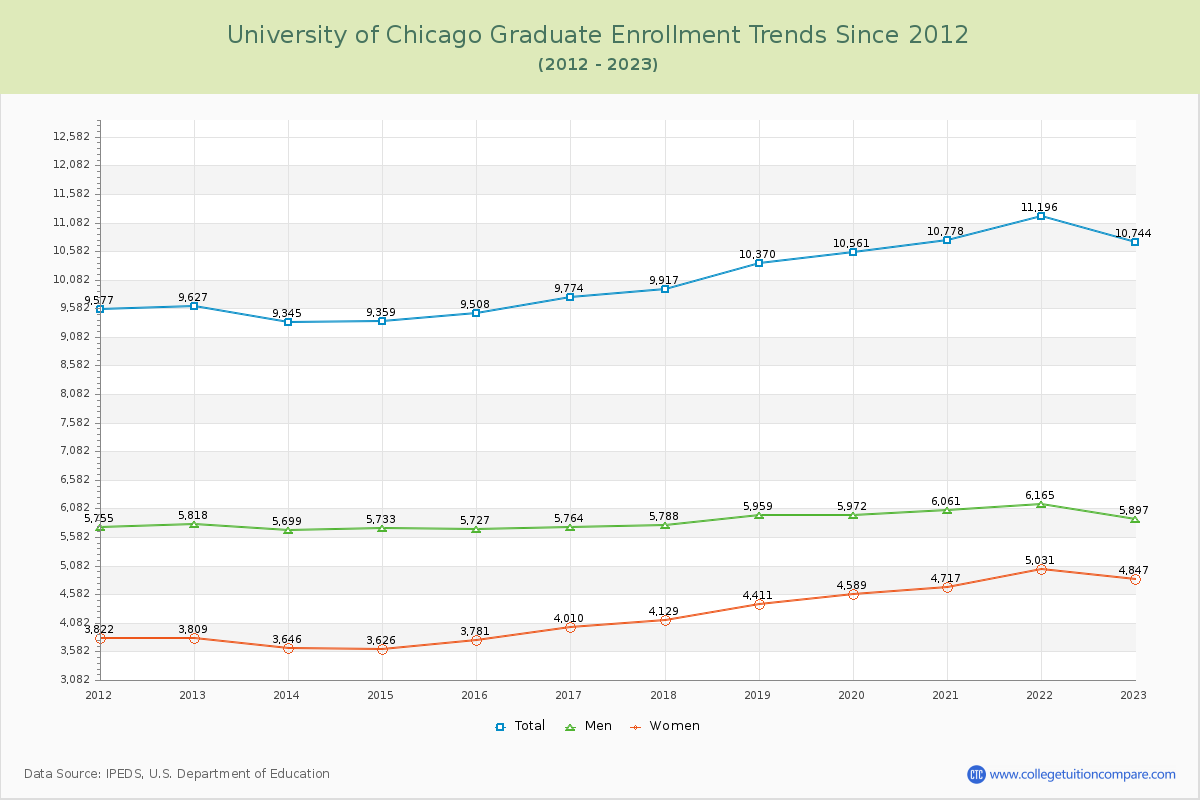
41.41% of total students is undergraduate students and 58.59% students is graduate students. The number of undergraduate students has increased by 1,977 and the graduate enrollment has increased by 1,117 over past 10 years.
The female to male ratio is 0.85 to 1 and it means that there are slightly more male students enrolled in U of Chicago than female students.
The following table and chart illustrate the changes in student population by gender at University of Chicago since 2012.
| Year | Total | Undergraduate | Graduate | ||||
|---|---|---|---|---|---|---|---|
| Total | Men | Women | Total | Men | Women | ||
| 2012-13 | 15,245 | 5,618 | 2,963 | 2,655 | 9,627 | 5,818 | 3,809 |
| 2013-14 | 15,048 -197 | 5,703 85 | 3,023 60 | 2,680 25 | 9,345 -282 | 5,699 -119 | 3,646 -163 |
| 2014-15 | 15,097 49 | 5,738 35 | 3,023 0 | 2,715 35 | 9,359 14 | 5,733 34 | 3,626 -20 |
| 2015-16 | 15,391 294 | 5,883 145 | 3,083 60 | 2,800 85 | 9,508 149 | 5,727 -6 | 3,781 155 |
| 2016-17 | 15,775 384 | 6,001 118 | 3,089 6 | 2,912 112 | 9,774 266 | 5,764 37 | 4,010 229 |
| 2017-18 | 16,227 452 | 6,310 309 | 3,218 129 | 3,092 180 | 9,917 143 | 5,788 24 | 4,129 119 |
| 2018-19 | 17,002 775 | 6,632 322 | 3,389 171 | 3,243 151 | 10,370 453 | 5,959 171 | 4,411 282 |
| 2019-20 | 17,452 450 | 6,891 259 | 3,512 123 | 3,379 136 | 10,561 191 | 5,972 13 | 4,589 178 |
| 2020-21 | 17,834 382 | 7,056 165 | 3,670 158 | 3,386 7 | 10,778 217 | 6,061 89 | 4,717 128 |
| 2021-22 | 18,832 998 | 7,636 580 | 3,986 316 | 3,650 264 | 11,196 418 | 6,165 104 | 5,031 314 |
| 2022-23 | 18,339 -493 | 7,595 -41 | 4,028 42 | 3,567 -83 | 10,744 -452 | 5,897 -268 | 4,847 -184 |
| Average | 16,567 | 6,460 | 3,362 | 3,098 | 10,107 | 5,871 | 4,236 |