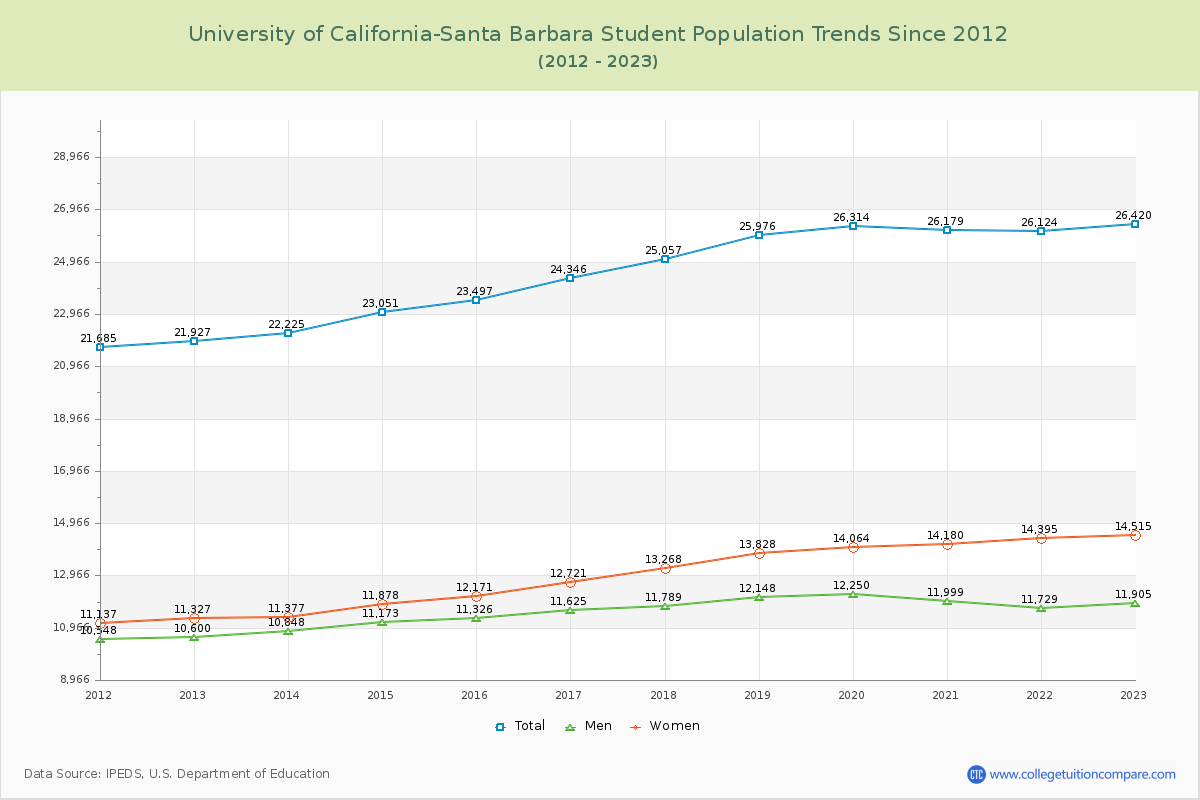
Student Population Changes
The average student population over the last 12 years is 24,647 where 26,420 students are attending the school for the academic year 2022-2023.
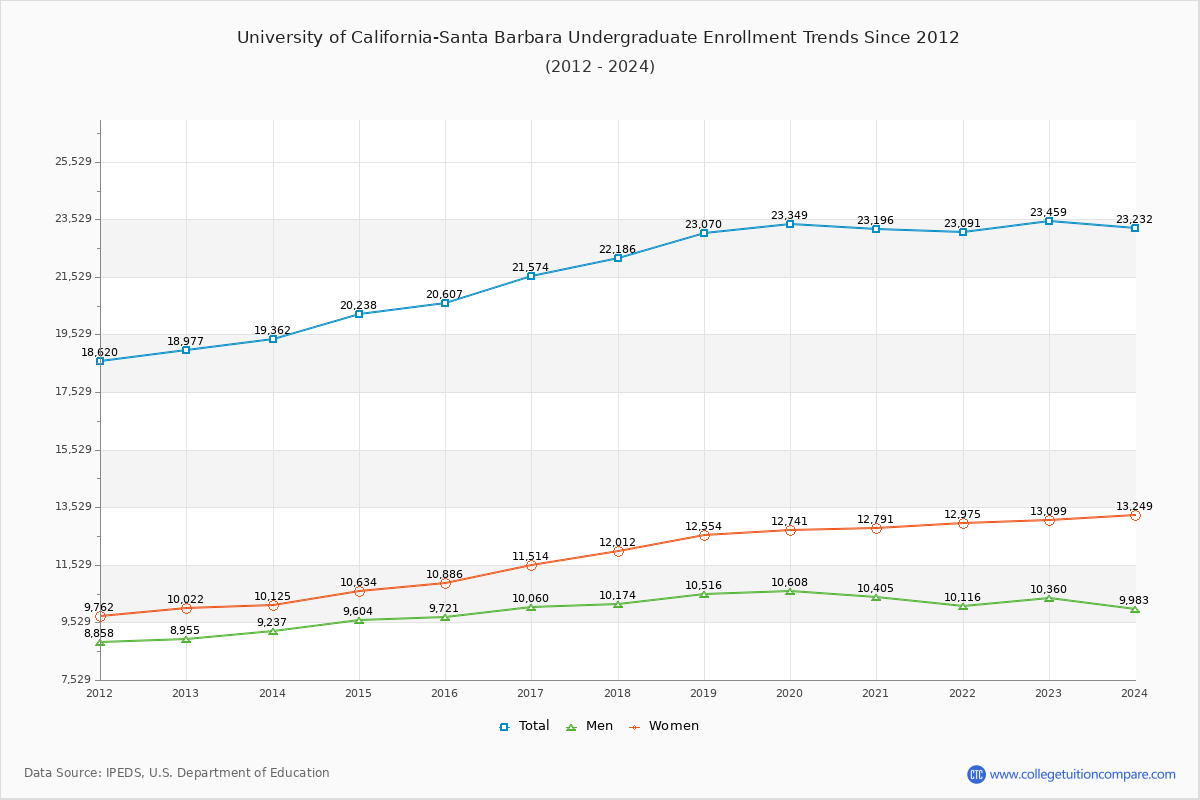
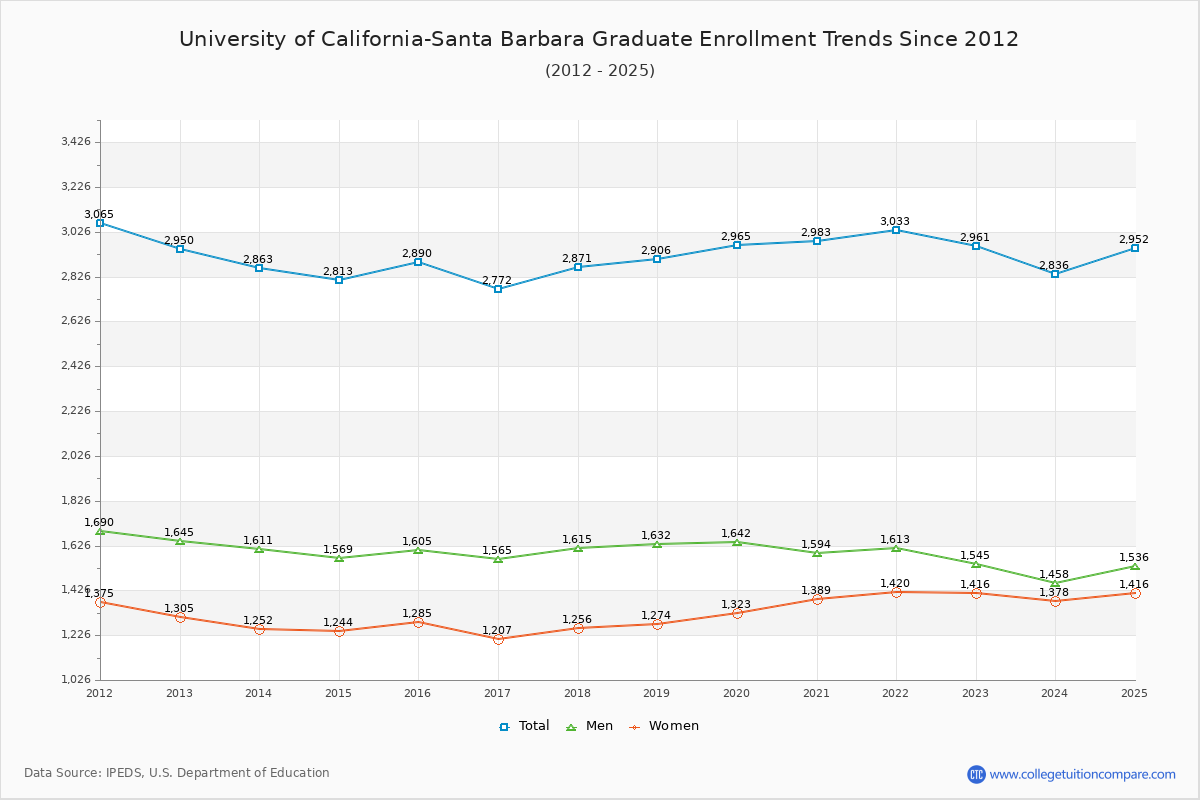
88.79% of total students is undergraduate students and 11.21% students is graduate students. The number of undergraduate students has increased by 4,482 and the graduate enrollment has increased by 11 over past 10 years.
The female to male ratio is 1.22 to 1 and it means that there are slightly more female students enrolled in UCSB than male students.
The following table and chart illustrate the changes in student population by gender at University of California-Santa Barbara since 2012.
| Year | Total | Undergraduate | Graduate | ||||
|---|---|---|---|---|---|---|---|
| Total | Men | Women | Total | Men | Women | ||
| 2012-13 | 21,927 | 18,977 | 8,955 | 10,022 | 2,950 | 1,645 | 1,305 |
| 2013-14 | 22,225 298 | 19,362 385 | 9,237 282 | 10,125 103 | 2,863 -87 | 1,611 -34 | 1,252 -53 |
| 2014-15 | 23,051 826 | 20,238 876 | 9,604 367 | 10,634 509 | 2,813 -50 | 1,569 -42 | 1,244 -8 |
| 2015-16 | 23,497 446 | 20,607 369 | 9,721 117 | 10,886 252 | 2,890 77 | 1,605 36 | 1,285 41 |
| 2016-17 | 24,346 849 | 21,574 967 | 10,060 339 | 11,514 628 | 2,772 -118 | 1,565 -40 | 1,207 -78 |
| 2017-18 | 25,057 711 | 22,186 612 | 10,174 114 | 12,012 498 | 2,871 99 | 1,615 50 | 1,256 49 |
| 2018-19 | 25,976 919 | 23,070 884 | 10,516 342 | 12,554 542 | 2,906 35 | 1,632 17 | 1,274 18 |
| 2019-20 | 26,314 338 | 23,349 279 | 10,608 92 | 12,741 187 | 2,965 59 | 1,642 10 | 1,323 49 |
| 2020-21 | 26,179 -135 | 23,196 -153 | 10,405 -203 | 12,791 50 | 2,983 18 | 1,594 -48 | 1,389 66 |
| 2021-22 | 26,124 -55 | 23,091 -105 | 10,116 -289 | 12,975 184 | 3,033 50 | 1,613 19 | 1,420 31 |
| 2022-23 | 26,420 296 | 23,459 368 | 10,360 244 | 13,099 124 | 2,961 -72 | 1,545 -68 | 1,416 -4 |
| Average | 24,647 | 21,737 | 9,978 | 11,759 | 2,910 | 1,603 | 1,306 |