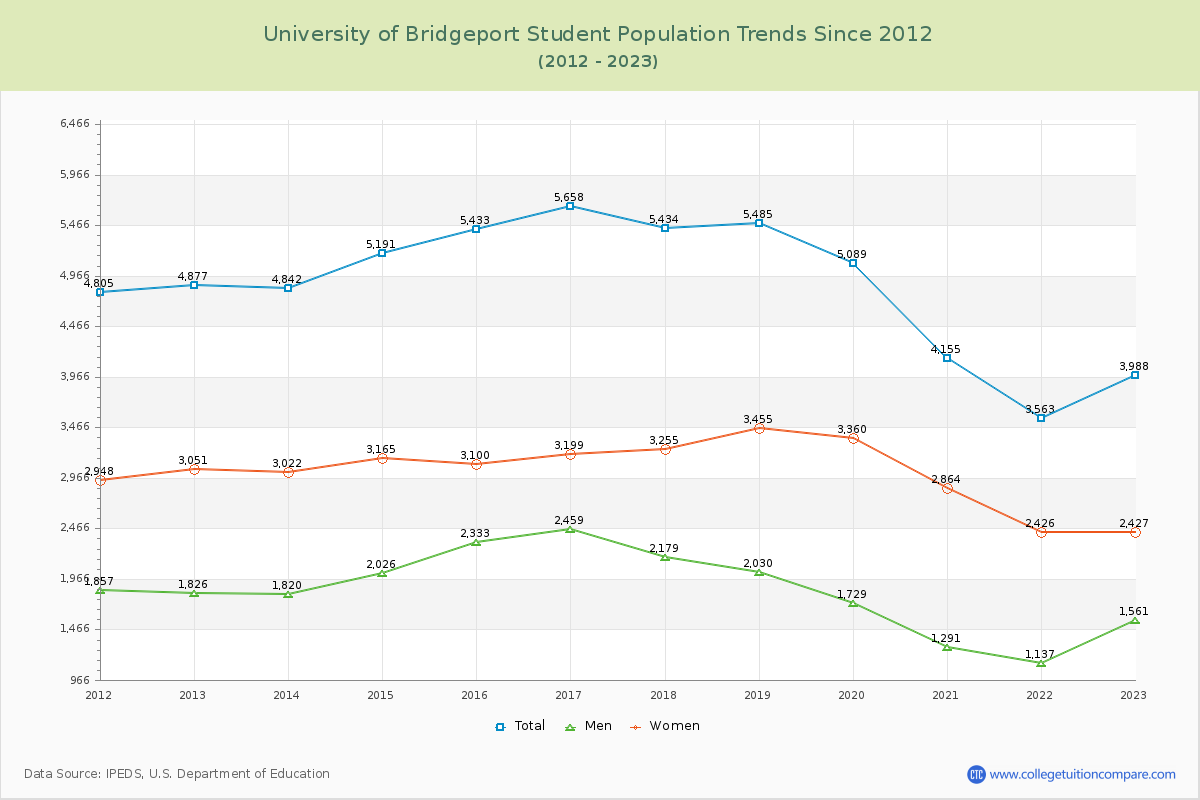
Student Population Changes
The average student population over the last 12 years is 4,883 where 3,988 students are attending the school for the academic year 2022-2023.
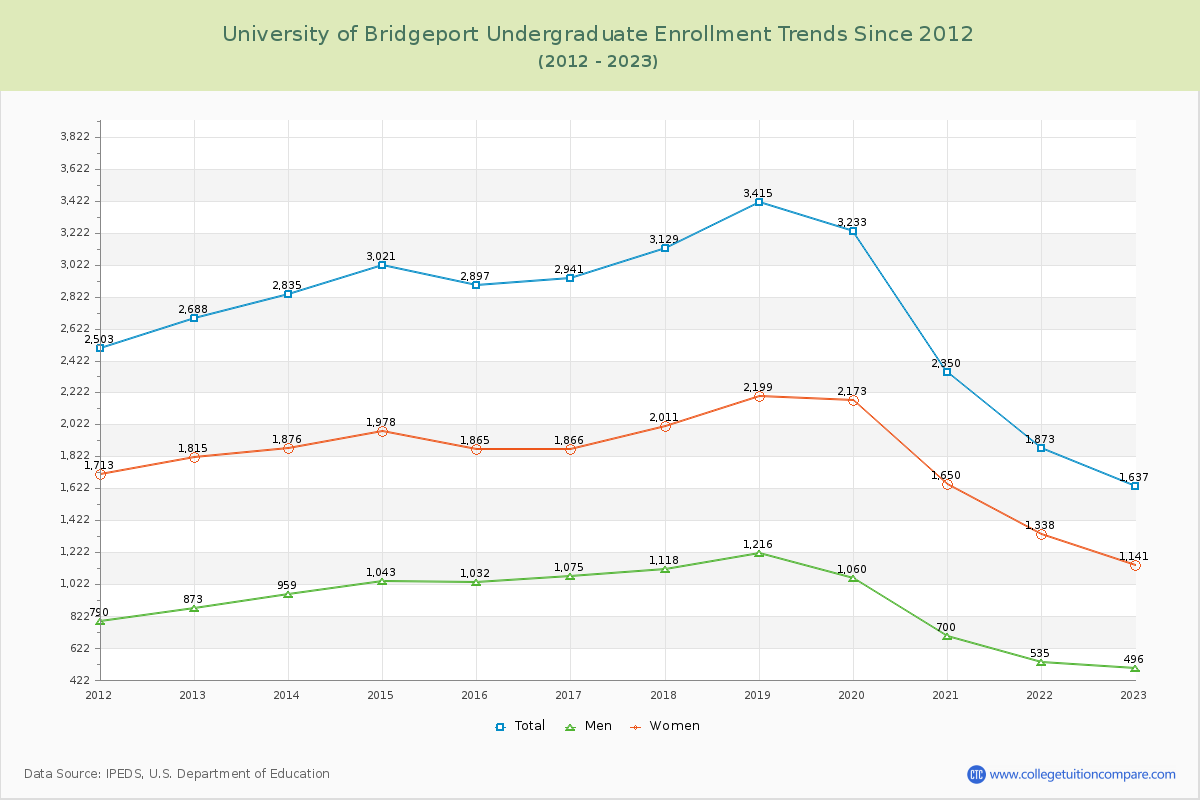
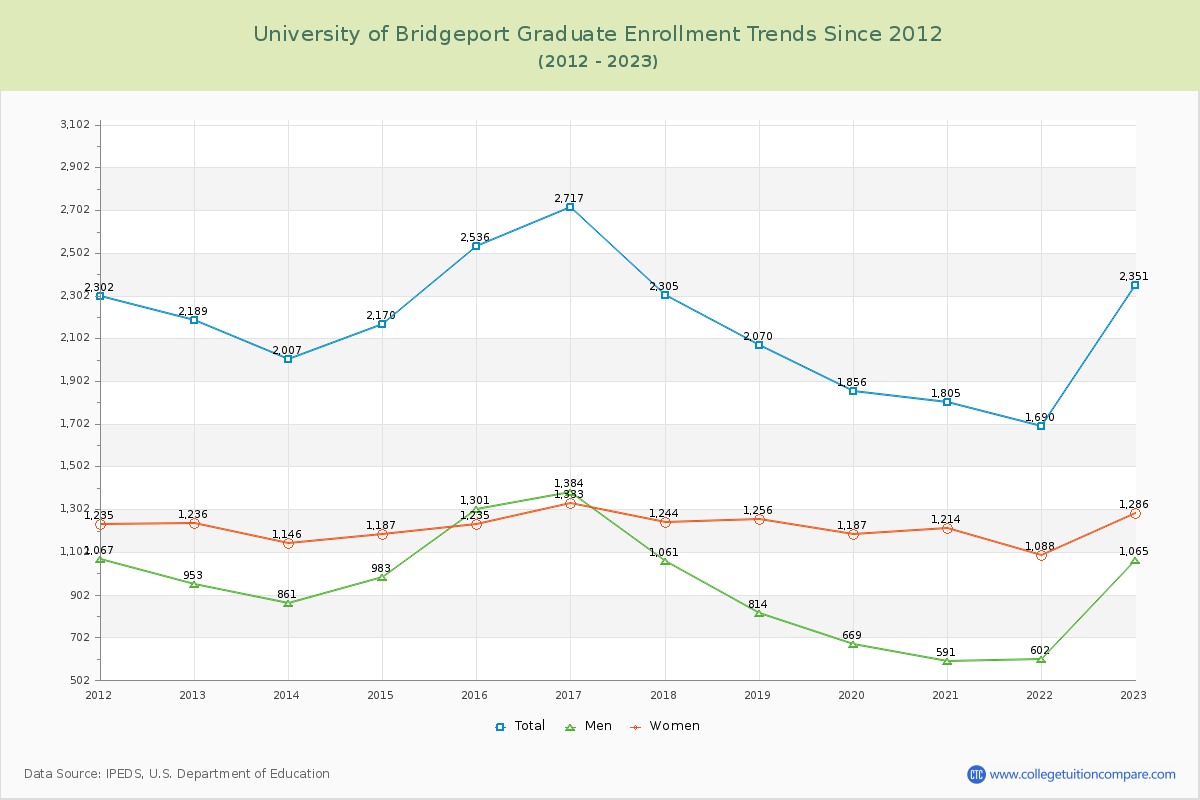
41.05% of total students is undergraduate students and 58.95% students is graduate students. The number of undergraduate students has decreased by 1,051 and the graduate enrollment has increased by 162 over past 10 years.
The female to male ratio is 1.55 to 1 and it means that there are more female students enrolled in U of Bridgeport than male students.
The following table and chart illustrate the changes in student population by gender at University of Bridgeport since 2012.
| Year | Total | Undergraduate | Graduate | ||||
|---|---|---|---|---|---|---|---|
| Total | Men | Women | Total | Men | Women | ||
| 2012-13 | 4,877 | 2,688 | 873 | 1,815 | 2,189 | 953 | 1,236 |
| 2013-14 | 4,842 -35 | 2,835 147 | 959 86 | 1,876 61 | 2,007 -182 | 861 -92 | 1,146 -90 |
| 2014-15 | 5,191 349 | 3,021 186 | 1,043 84 | 1,978 102 | 2,170 163 | 983 122 | 1,187 41 |
| 2015-16 | 5,433 242 | 2,897 -124 | 1,032 -11 | 1,865 -113 | 2,536 366 | 1,301 318 | 1,235 48 |
| 2016-17 | 5,658 225 | 2,941 44 | 1,075 43 | 1,866 1 | 2,717 181 | 1,384 83 | 1,333 98 |
| 2017-18 | 5,434 -224 | 3,129 188 | 1,118 43 | 2,011 145 | 2,305 -412 | 1,061 -323 | 1,244 -89 |
| 2018-19 | 5,485 51 | 3,415 286 | 1,216 98 | 2,199 188 | 2,070 -235 | 814 -247 | 1,256 12 |
| 2019-20 | 5,089 -396 | 3,233 -182 | 1,060 -156 | 2,173 -26 | 1,856 -214 | 669 -145 | 1,187 -69 |
| 2020-21 | 4,155 -934 | 2,350 -883 | 700 -360 | 1,650 -523 | 1,805 -51 | 591 -78 | 1,214 27 |
| 2021-22 | 3,563 -592 | 1,873 -477 | 535 -165 | 1,338 -312 | 1,690 -115 | 602 11 | 1,088 -126 |
| 2022-23 | 3,988 425 | 1,637 -236 | 496 -39 | 1,141 -197 | 2,351 661 | 1,065 463 | 1,286 198 |
| Average | 4,883 | 2,729 | 919 | 1,810 | 2,154 | 935 | 1,219 |