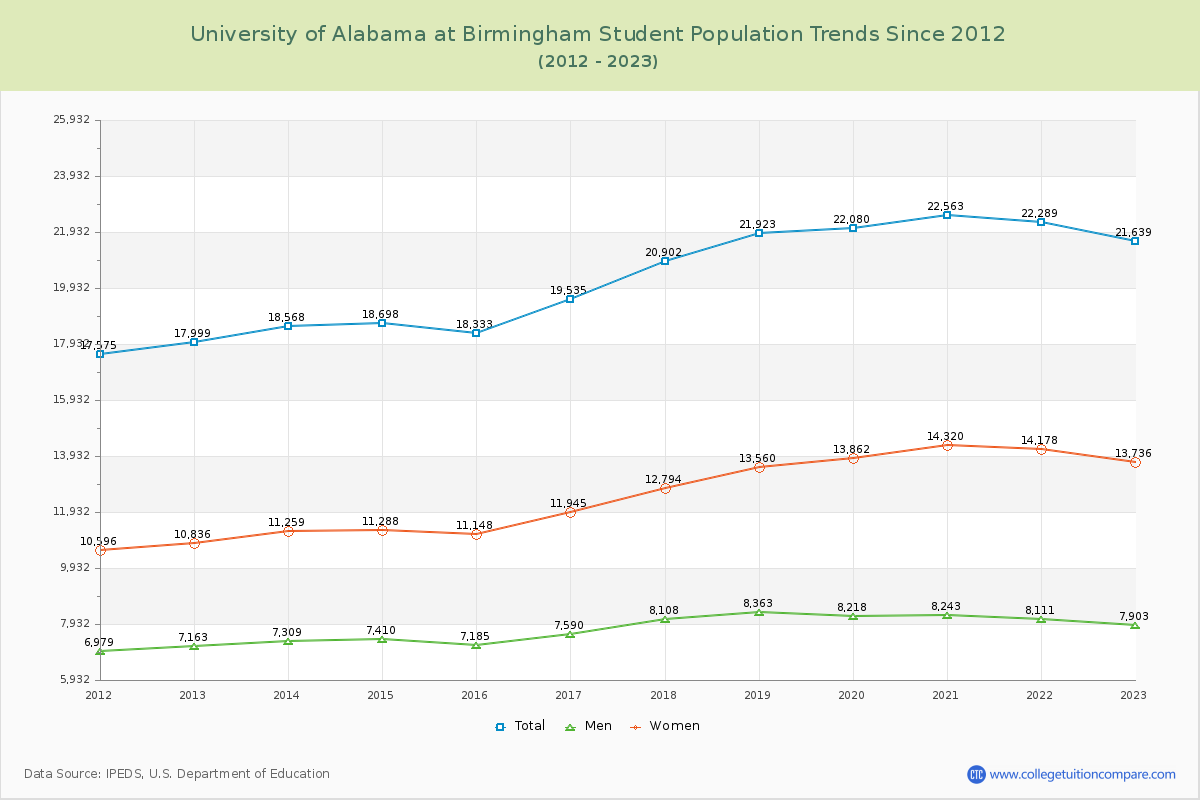
Student Population Changes
The average student population over the last 12 years is 20,412 where 21,639 students are attending the school for the academic year 2022-2023.
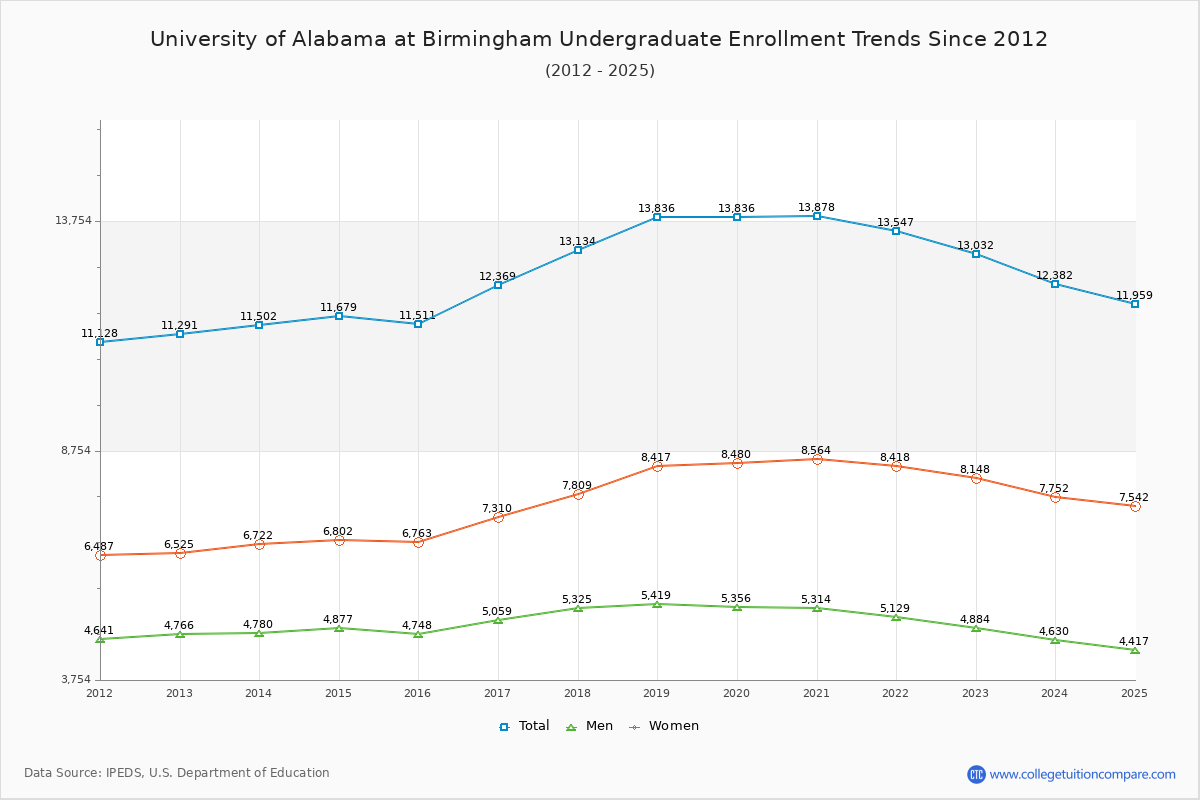
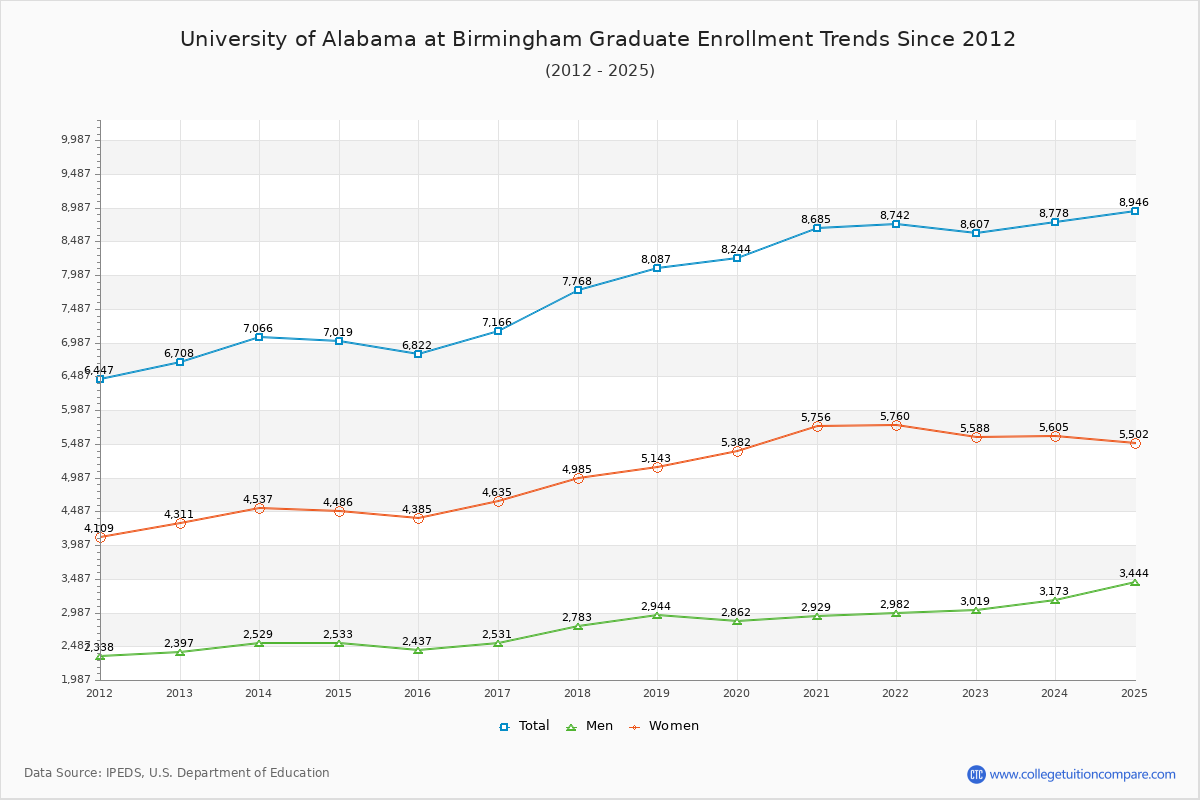
60.22% of total students is undergraduate students and 39.78% students is graduate students. The number of undergraduate students has increased by 1,741 and the graduate enrollment has increased by 1,899 over past 10 years.
The female to male ratio is 1.74 to 1 and it means that there are more female students enrolled in UAB than male students.
The following table and chart illustrate the changes in student population by gender at University of Alabama at Birmingham since 2012.
| Year | Total | Undergraduate | Graduate | ||||
|---|---|---|---|---|---|---|---|
| Total | Men | Women | Total | Men | Women | ||
| 2012-13 | 17,999 | 11,291 | 4,766 | 6,525 | 6,708 | 2,397 | 4,311 |
| 2013-14 | 18,568 569 | 11,502 211 | 4,780 14 | 6,722 197 | 7,066 358 | 2,529 132 | 4,537 226 |
| 2014-15 | 18,698 130 | 11,679 177 | 4,877 97 | 6,802 80 | 7,019 -47 | 2,533 4 | 4,486 -51 |
| 2015-16 | 18,333 -365 | 11,511 -168 | 4,748 -129 | 6,763 -39 | 6,822 -197 | 2,437 -96 | 4,385 -101 |
| 2016-17 | 19,535 1,202 | 12,369 858 | 5,059 311 | 7,310 547 | 7,166 344 | 2,531 94 | 4,635 250 |
| 2017-18 | 20,902 1,367 | 13,134 765 | 5,325 266 | 7,809 499 | 7,768 602 | 2,783 252 | 4,985 350 |
| 2018-19 | 21,923 1,021 | 13,836 702 | 5,419 94 | 8,417 608 | 8,087 319 | 2,944 161 | 5,143 158 |
| 2019-20 | 22,080 157 | 13,836 0 | 5,356 -63 | 8,480 63 | 8,244 157 | 2,862 -82 | 5,382 239 |
| 2020-21 | 22,563 483 | 13,878 42 | 5,314 -42 | 8,564 84 | 8,685 441 | 2,929 67 | 5,756 374 |
| 2021-22 | 22,289 -274 | 13,547 -331 | 5,129 -185 | 8,418 -146 | 8,742 57 | 2,982 53 | 5,760 4 |
| 2022-23 | 21,639 -650 | 13,032 -515 | 4,884 -245 | 8,148 -270 | 8,607 -135 | 3,019 37 | 5,588 -172 |
| Average | 20,412 | 12,692 | 5,060 | 7,633 | 7,719 | 2,722 | 4,997 |