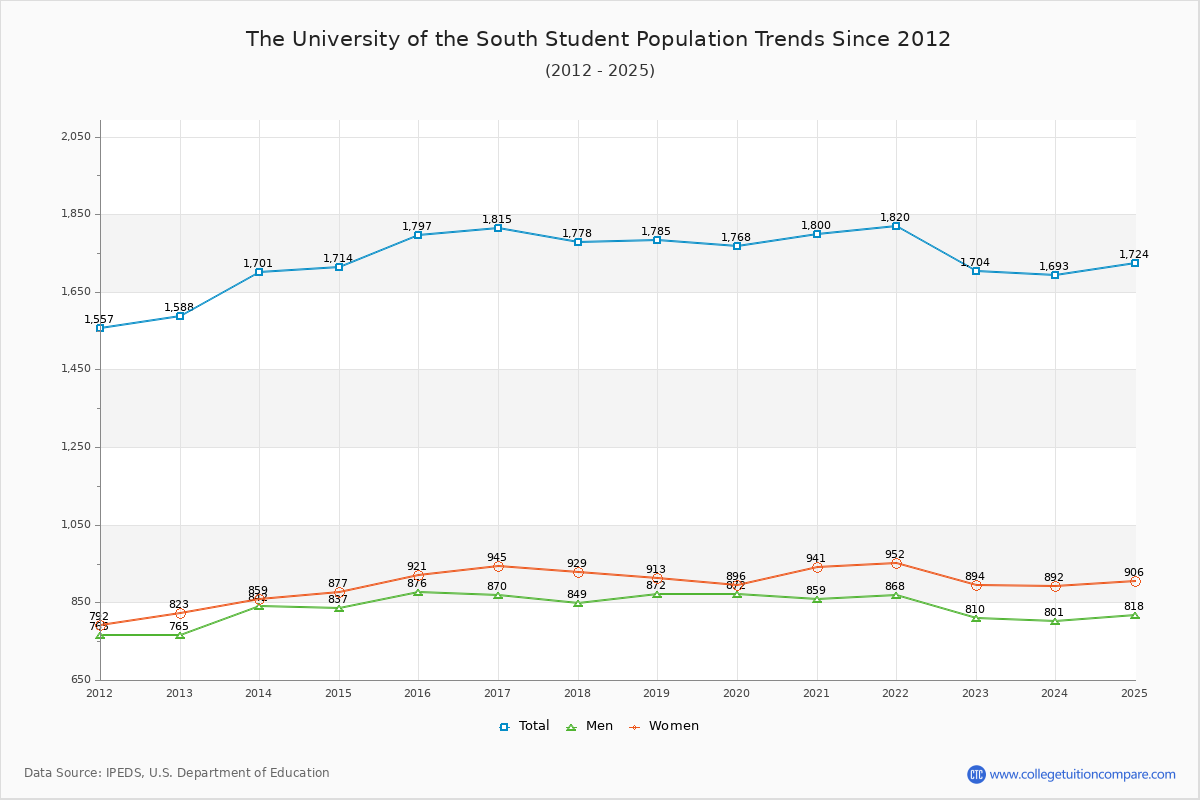
Student Population Changes
The average student population over the last 12 years is 1,752 where 1,704 students are attending the school for the academic year 2022-2023.
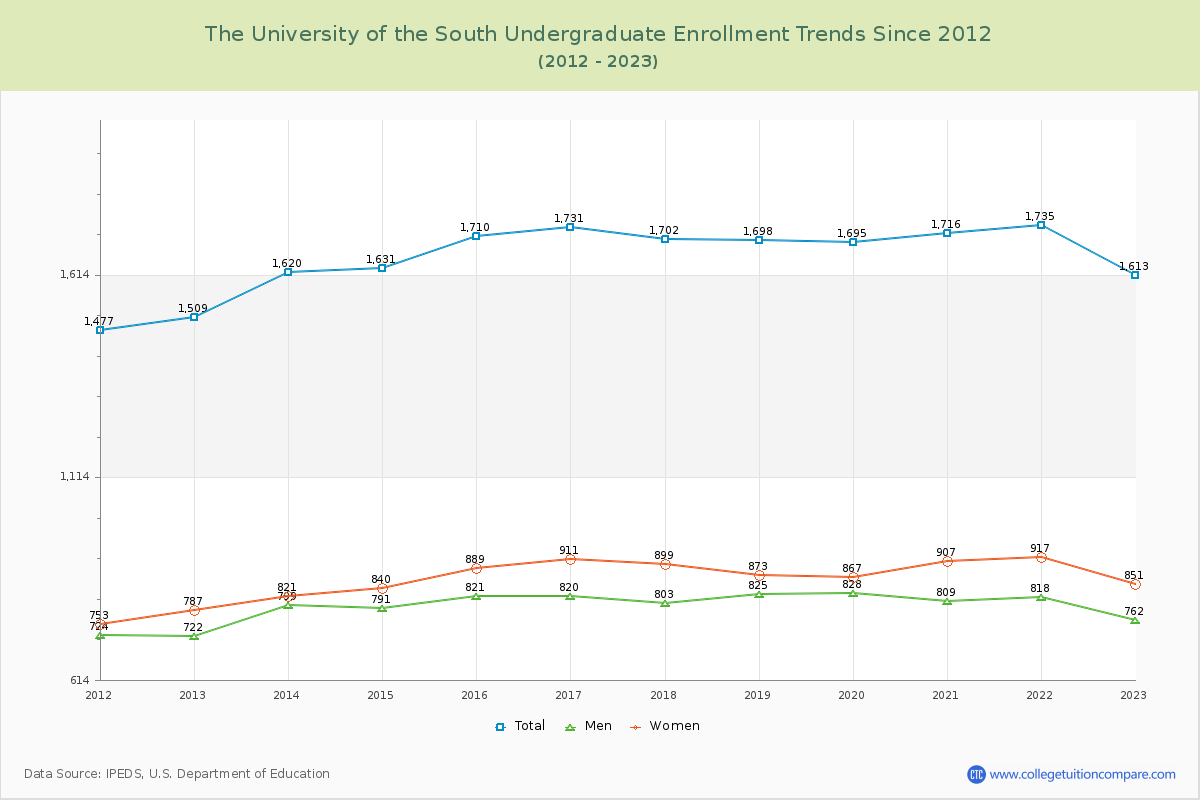
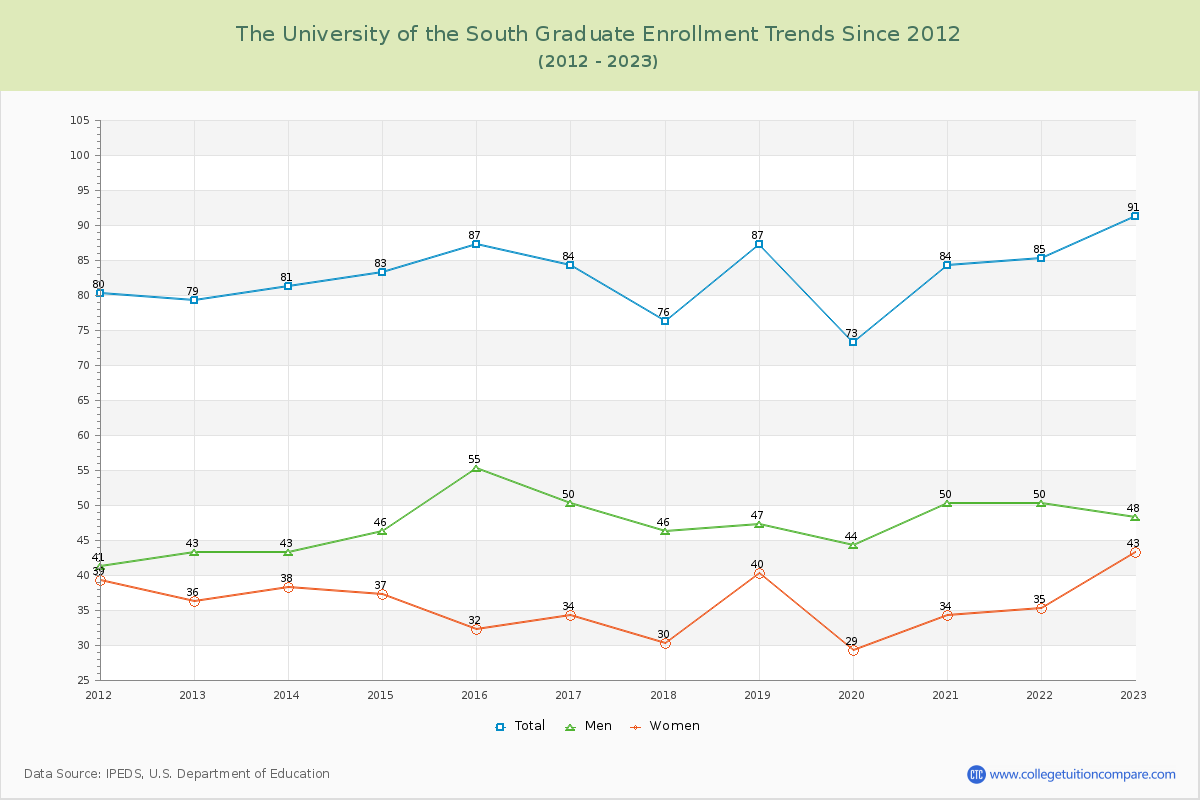
94.66% of total students is undergraduate students and 5.34% students is graduate students. The number of undergraduate students has increased by 104 and the graduate enrollment has increased by 12 over past 10 years.
The female to male ratio is 1.10 to 1 and it means that there are similar numbers of female and male students enrolled in Sewanee.
The following table and chart illustrate the changes in student population by gender at The University of the South since 2012.
| Year | Total | Undergraduate | Graduate | ||||
|---|---|---|---|---|---|---|---|
| Total | Men | Women | Total | Men | Women | ||
| 2012-13 | 1,588 | 1,509 | 722 | 787 | 79 | 43 | 36 |
| 2013-14 | 1,701 113 | 1,620 111 | 799 77 | 821 34 | 81 2 | 43 0 | 38 2 |
| 2014-15 | 1,714 13 | 1,631 11 | 791 -8 | 840 19 | 83 2 | 46 3 | 37 -1 |
| 2015-16 | 1,797 83 | 1,710 79 | 821 30 | 889 49 | 87 4 | 55 9 | 32 -5 |
| 2016-17 | 1,815 18 | 1,731 21 | 820 -1 | 911 22 | 84 -3 | 50 -5 | 34 2 |
| 2017-18 | 1,778 -37 | 1,702 -29 | 803 -17 | 899 -12 | 76 -8 | 46 -4 | 30 -4 |
| 2018-19 | 1,785 7 | 1,698 -4 | 825 22 | 873 -26 | 87 11 | 47 1 | 40 10 |
| 2019-20 | 1,768 -17 | 1,695 -3 | 828 3 | 867 -6 | 73 -14 | 44 -3 | 29 -11 |
| 2020-21 | 1,800 32 | 1,716 21 | 809 -19 | 907 40 | 84 11 | 50 6 | 34 5 |
| 2021-22 | 1,820 20 | 1,735 19 | 818 9 | 917 10 | 85 1 | 50 0 | 35 1 |
| 2022-23 | 1,704 -116 | 1,613 -122 | 762 -56 | 851 -66 | 91 6 | 48 -2 | 43 8 |
| Average | 1,752 | 1,669 | 800 | 869 | 83 | 47 | 35 |