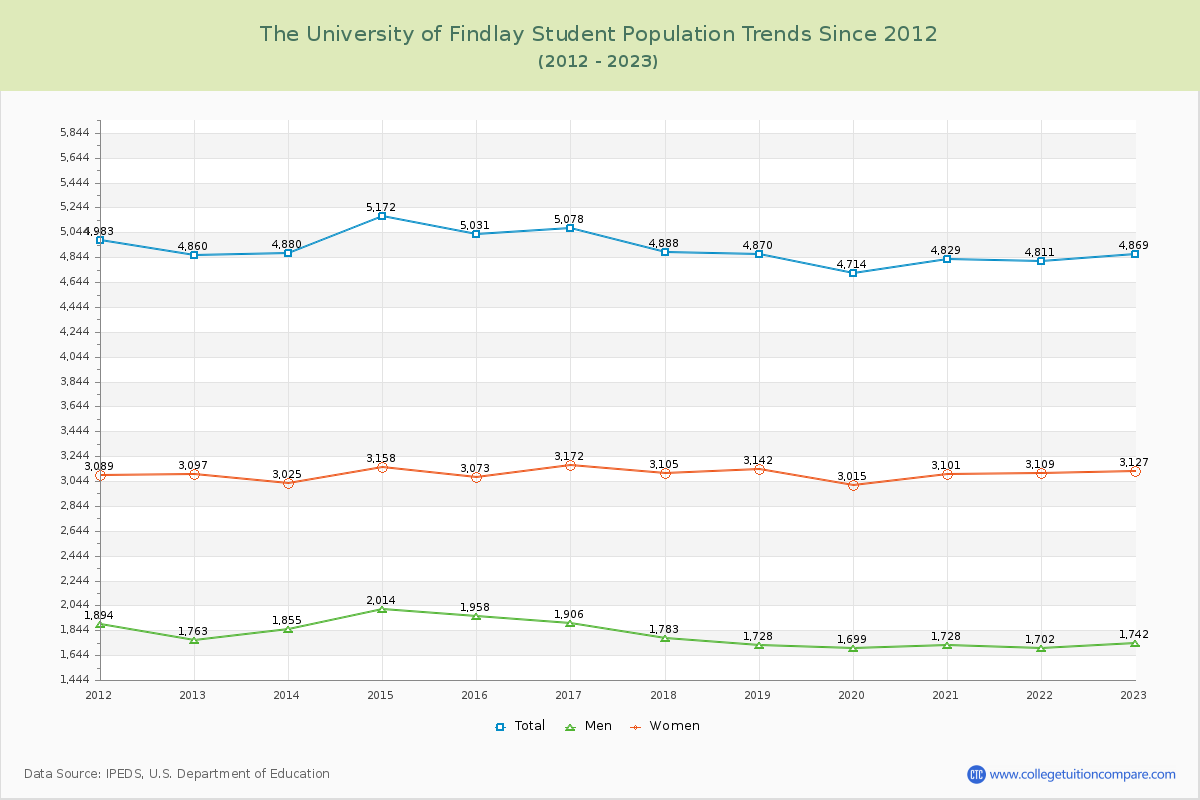
Student Population Changes
The average student population over the last 12 years is 4,909 where 4,869 students are attending the school for the academic year 2022-2023.
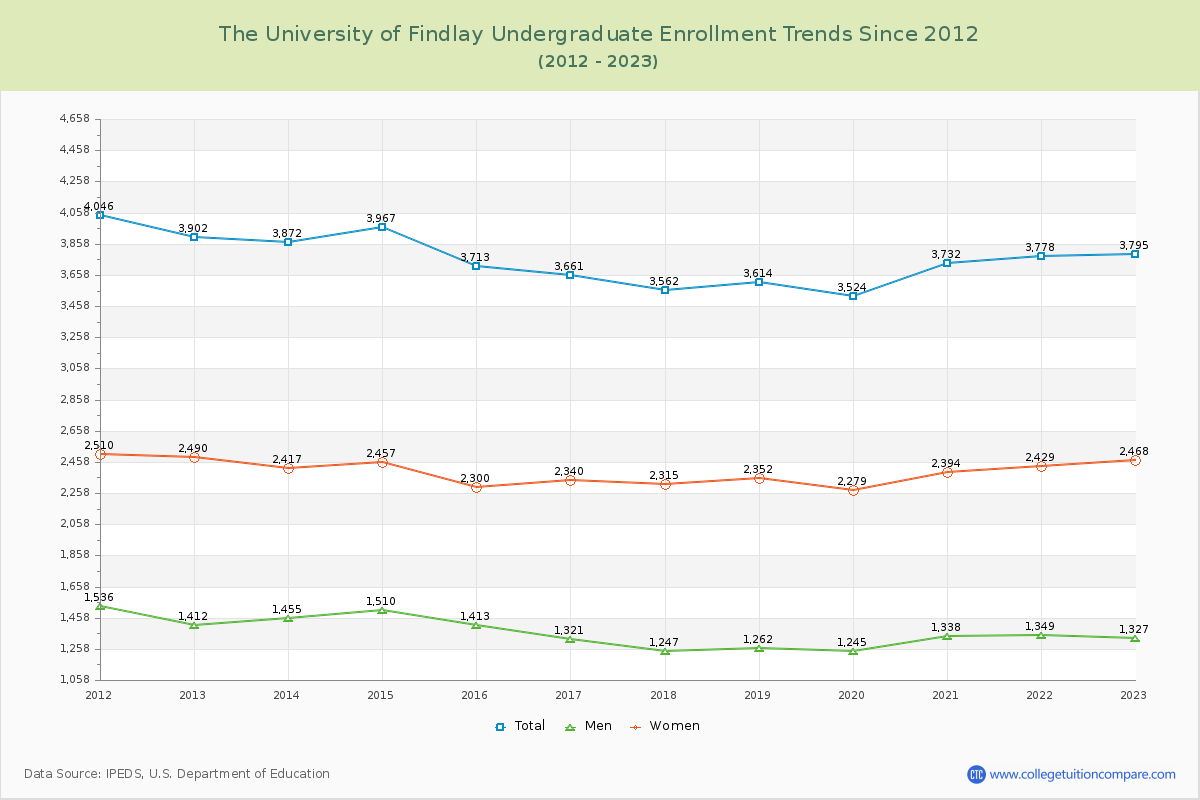
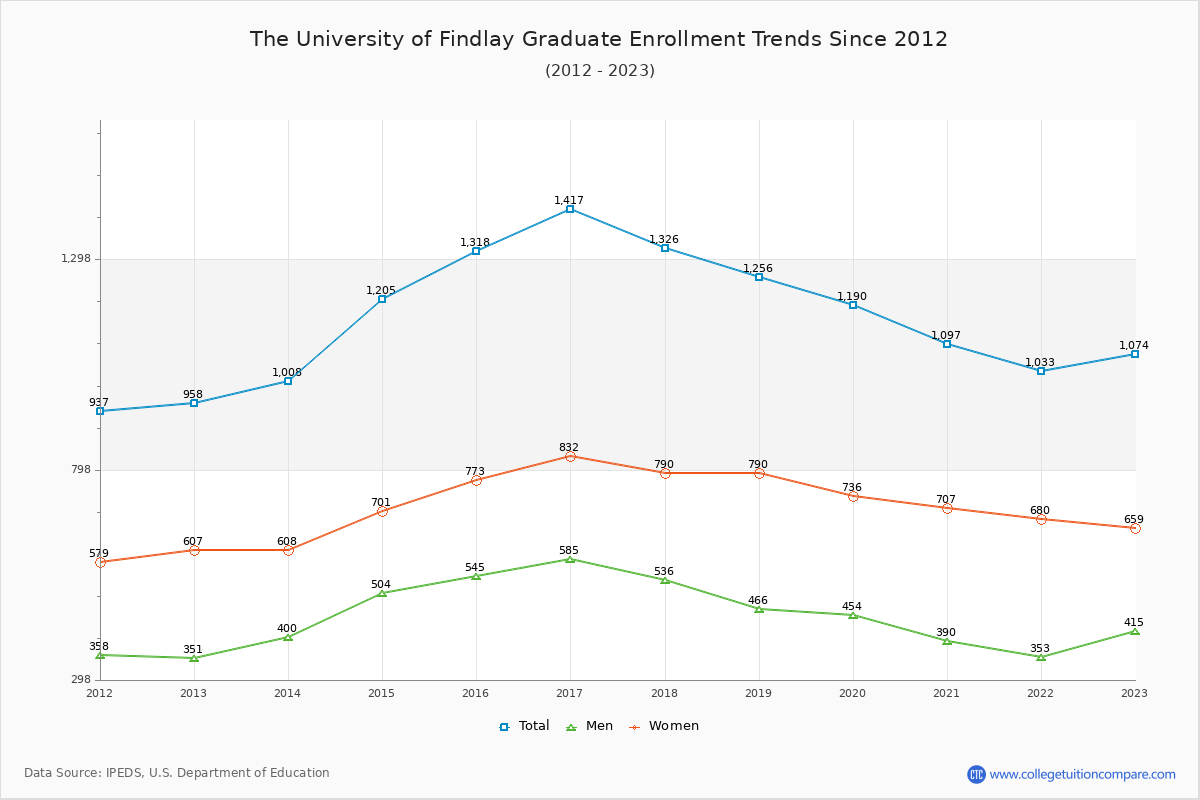
77.94% of total students is undergraduate students and 22.06% students is graduate students. The number of undergraduate students has decreased by 107 and the graduate enrollment has increased by 116 over past 10 years.
The female to male ratio is 1.80 to 1 and it means that there are more female students enrolled in The University of Findlay than male students.
The following table and chart illustrate the changes in student population by gender at The University of Findlay since 2012.
| Year | Total | Undergraduate | Graduate | ||||
|---|---|---|---|---|---|---|---|
| Total | Men | Women | Total | Men | Women | ||
| 2012-13 | 4,860 | 3,902 | 1,412 | 2,490 | 958 | 351 | 607 |
| 2013-14 | 4,880 20 | 3,872 -30 | 1,455 43 | 2,417 -73 | 1,008 50 | 400 49 | 608 1 |
| 2014-15 | 5,172 292 | 3,967 95 | 1,510 55 | 2,457 40 | 1,205 197 | 504 104 | 701 93 |
| 2015-16 | 5,031 -141 | 3,713 -254 | 1,413 -97 | 2,300 -157 | 1,318 113 | 545 41 | 773 72 |
| 2016-17 | 5,078 47 | 3,661 -52 | 1,321 -92 | 2,340 40 | 1,417 99 | 585 40 | 832 59 |
| 2017-18 | 4,888 -190 | 3,562 -99 | 1,247 -74 | 2,315 -25 | 1,326 -91 | 536 -49 | 790 -42 |
| 2018-19 | 4,870 -18 | 3,614 52 | 1,262 15 | 2,352 37 | 1,256 -70 | 466 -70 | 790 0 |
| 2019-20 | 4,714 -156 | 3,524 -90 | 1,245 -17 | 2,279 -73 | 1,190 -66 | 454 -12 | 736 -54 |
| 2020-21 | 4,829 115 | 3,732 208 | 1,338 93 | 2,394 115 | 1,097 -93 | 390 -64 | 707 -29 |
| 2021-22 | 4,811 -18 | 3,778 46 | 1,349 11 | 2,429 35 | 1,033 -64 | 353 -37 | 680 -27 |
| 2022-23 | 4,869 58 | 3,795 17 | 1,327 -22 | 2,468 39 | 1,074 41 | 415 62 | 659 -21 |
| Average | 4,909 | 3,738 | 1,353 | 2,386 | 1,171 | 454 | 717 |