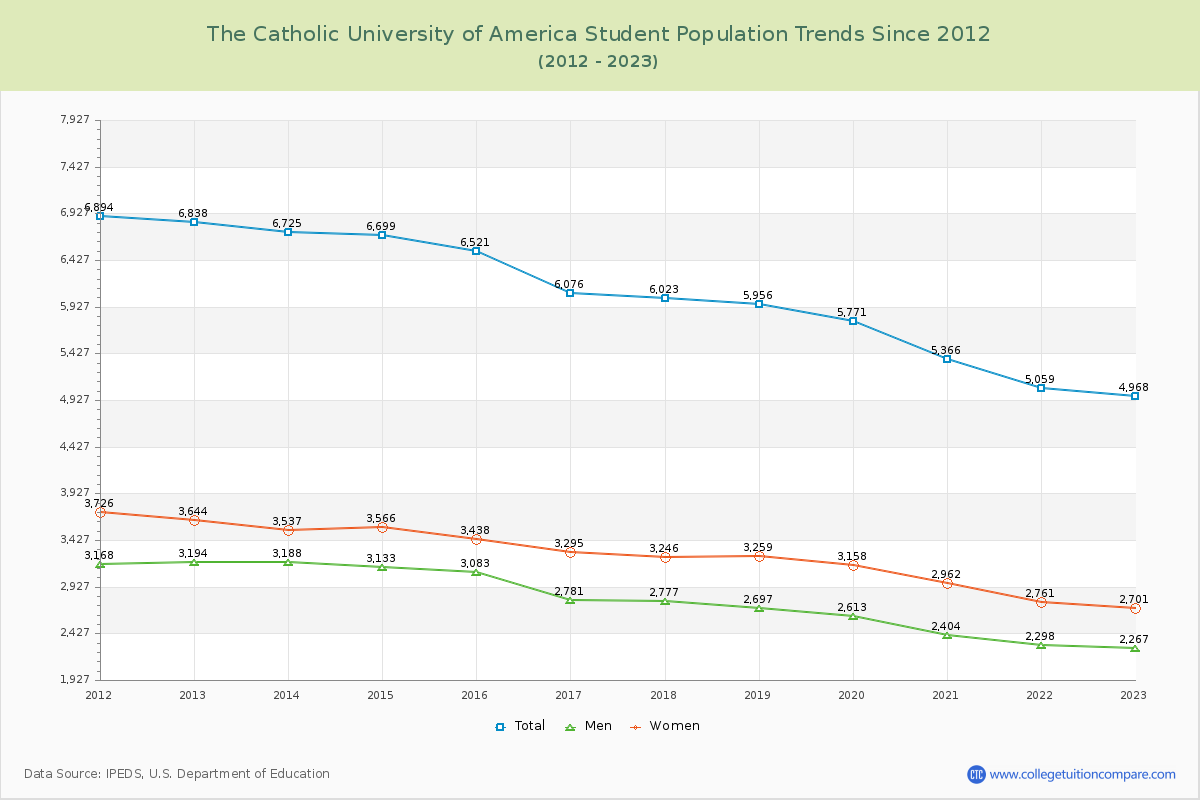
Student Population Changes
The average student population over the last 12 years is 6,000 where 4,968 students are attending the school for the academic year 2022-2023.
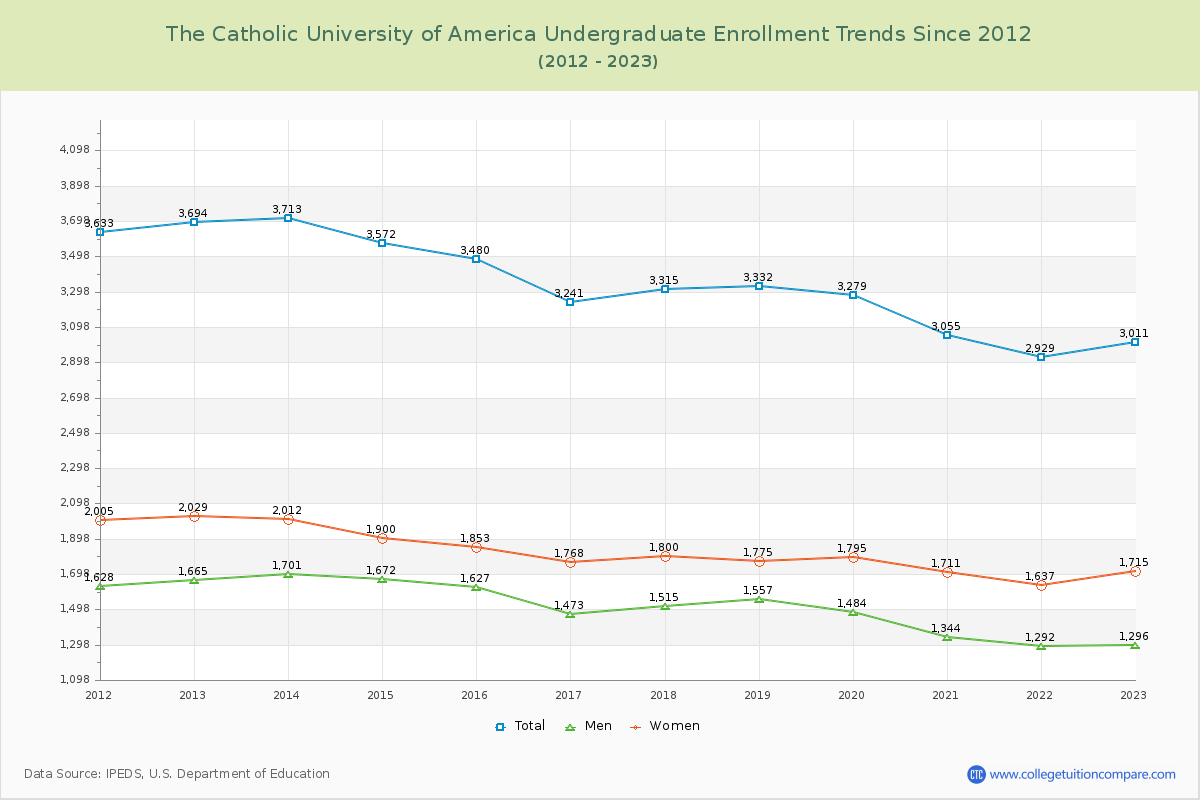
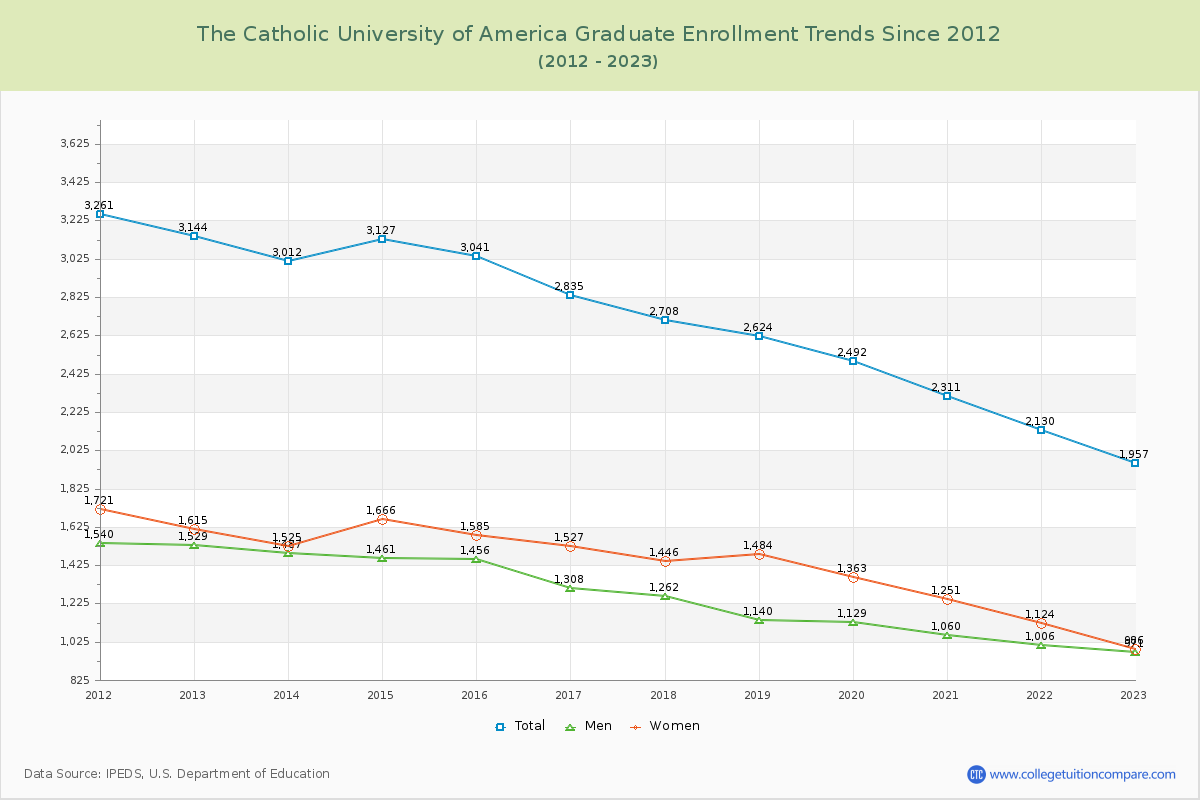
60.61% of total students is undergraduate students and 39.39% students is graduate students. The number of undergraduate students has decreased by 683 and the graduate enrollment has decreased by 1,187 over past 10 years.
The female to male ratio is 1.19 to 1 and it means that there are slightly more female students enrolled in The Catholic University of America than male students.
The following table and chart illustrate the changes in student population by gender at The Catholic University of America since 2012.
| Year | Total | Undergraduate | Graduate | ||||
|---|---|---|---|---|---|---|---|
| Total | Men | Women | Total | Men | Women | ||
| 2012-13 | 6,838 | 3,694 | 1,665 | 2,029 | 3,144 | 1,529 | 1,615 |
| 2013-14 | 6,725 -113 | 3,713 19 | 1,701 36 | 2,012 -17 | 3,012 -132 | 1,487 -42 | 1,525 -90 |
| 2014-15 | 6,699 -26 | 3,572 -141 | 1,672 -29 | 1,900 -112 | 3,127 115 | 1,461 -26 | 1,666 141 |
| 2015-16 | 6,521 -178 | 3,480 -92 | 1,627 -45 | 1,853 -47 | 3,041 -86 | 1,456 -5 | 1,585 -81 |
| 2016-17 | 6,076 -445 | 3,241 -239 | 1,473 -154 | 1,768 -85 | 2,835 -206 | 1,308 -148 | 1,527 -58 |
| 2017-18 | 6,023 -53 | 3,315 74 | 1,515 42 | 1,800 32 | 2,708 -127 | 1,262 -46 | 1,446 -81 |
| 2018-19 | 5,956 -67 | 3,332 17 | 1,557 42 | 1,775 -25 | 2,624 -84 | 1,140 -122 | 1,484 38 |
| 2019-20 | 5,771 -185 | 3,279 -53 | 1,484 -73 | 1,795 20 | 2,492 -132 | 1,129 -11 | 1,363 -121 |
| 2020-21 | 5,366 -405 | 3,055 -224 | 1,344 -140 | 1,711 -84 | 2,311 -181 | 1,060 -69 | 1,251 -112 |
| 2021-22 | 5,059 -307 | 2,929 -126 | 1,292 -52 | 1,637 -74 | 2,130 -181 | 1,006 -54 | 1,124 -127 |
| 2022-23 | 4,968 -91 | 3,011 82 | 1,296 4 | 1,715 78 | 1,957 -173 | 971 -35 | 986 -138 |
| Average | 6,000 | 3,329 | 1,511 | 1,818 | 2,671 | 1,255 | 1,416 |