Student Population Changes
The average student population over the last 12 years is 37,121 where 40,378 students are attending the school for the academic year 2022-2023.
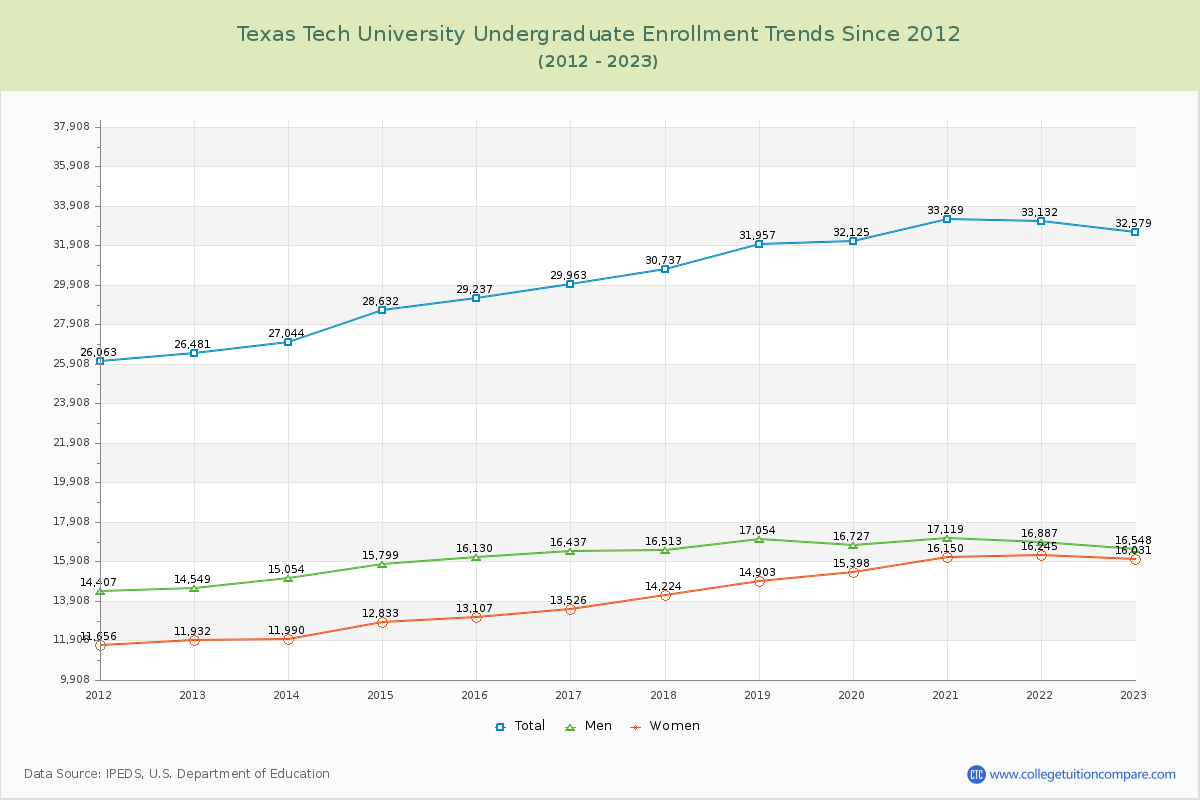
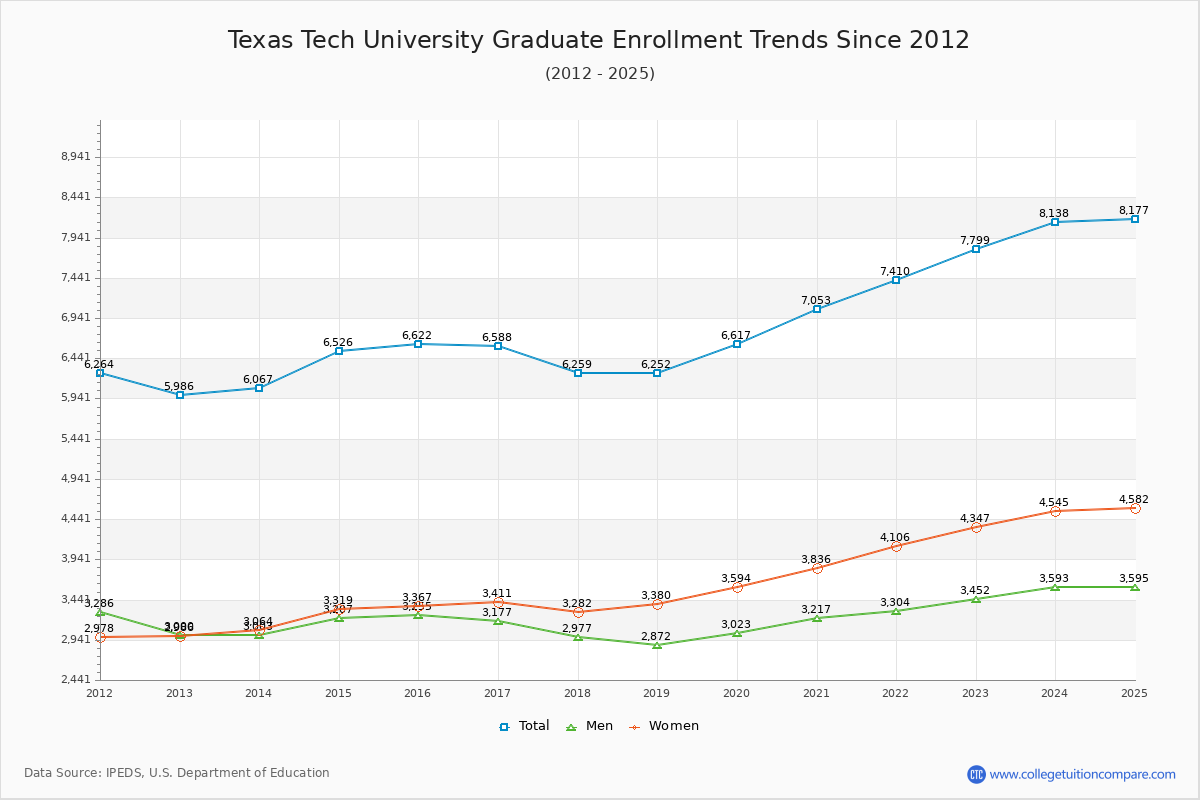
80.69% of total students is undergraduate students and 19.31% students is graduate students. The number of undergraduate students has increased by 6,098 and the graduate enrollment has increased by 1,813 over past 10 years.
The female to male ratio is 1.02 to 1 and it means that there are similar numbers of female and male students enrolled in Texas Tech.
The following table and chart illustrate the changes in student population by gender at Texas Tech University since 2012.
| Year | Total | Undergraduate | Graduate | ||||
|---|---|---|---|---|---|---|---|
| Total | Men | Women | Total | Men | Women | ||
| 2012-13 | 32,467 | 26,481 | 14,549 | 11,932 | 5,986 | 3,000 | 2,986 |
| 2013-14 | 33,111 644 | 27,044 563 | 15,054 505 | 11,990 58 | 6,067 81 | 3,003 3 | 3,064 78 |
| 2014-15 | 35,158 2,047 | 28,632 1,588 | 15,799 745 | 12,833 843 | 6,526 459 | 3,207 204 | 3,319 255 |
| 2015-16 | 35,859 701 | 29,237 605 | 16,130 331 | 13,107 274 | 6,622 96 | 3,255 48 | 3,367 48 |
| 2016-17 | 36,551 692 | 29,963 726 | 16,437 307 | 13,526 419 | 6,588 -34 | 3,177 -78 | 3,411 44 |
| 2017-18 | 36,996 445 | 30,737 774 | 16,513 76 | 14,224 698 | 6,259 -329 | 2,977 -200 | 3,282 -129 |
| 2018-19 | 38,209 1,213 | 31,957 1,220 | 17,054 541 | 14,903 679 | 6,252 -7 | 2,872 -105 | 3,380 98 |
| 2019-20 | 38,742 533 | 32,125 168 | 16,727 -327 | 15,398 495 | 6,617 365 | 3,023 151 | 3,594 214 |
| 2020-21 | 40,322 1,580 | 33,269 1,144 | 17,119 392 | 16,150 752 | 7,053 436 | 3,217 194 | 3,836 242 |
| 2021-22 | 40,542 220 | 33,132 -137 | 16,887 -232 | 16,245 95 | 7,410 357 | 3,304 87 | 4,106 270 |
| 2022-23 | 40,378 -164 | 32,579 -553 | 16,548 -339 | 16,031 -214 | 7,799 389 | 3,452 148 | 4,347 241 |
| Average | 37,121 | 30,469 | 16,256 | 14,213 | 6,653 | 3,135 | 3,517 |