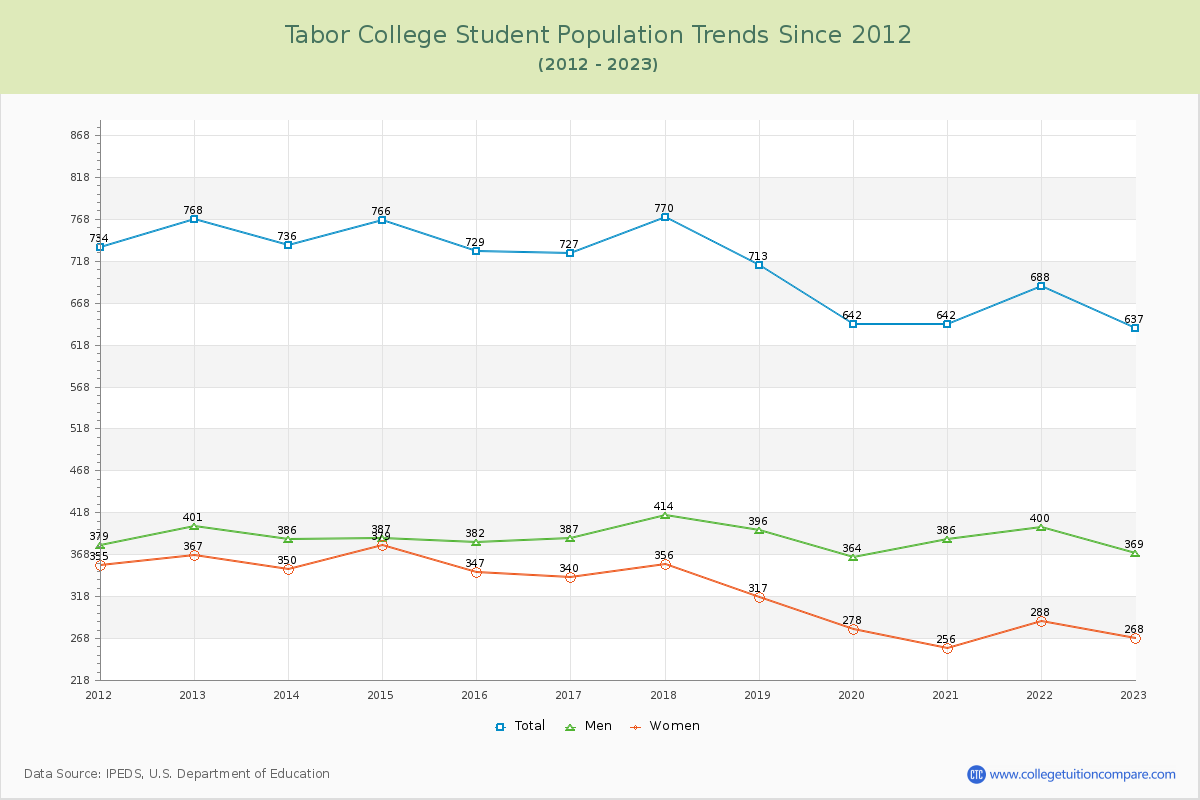
Student Population Changes
The average student population over the last 12 years is 711 where 637 students are attending the school for the academic year 2022-2023.
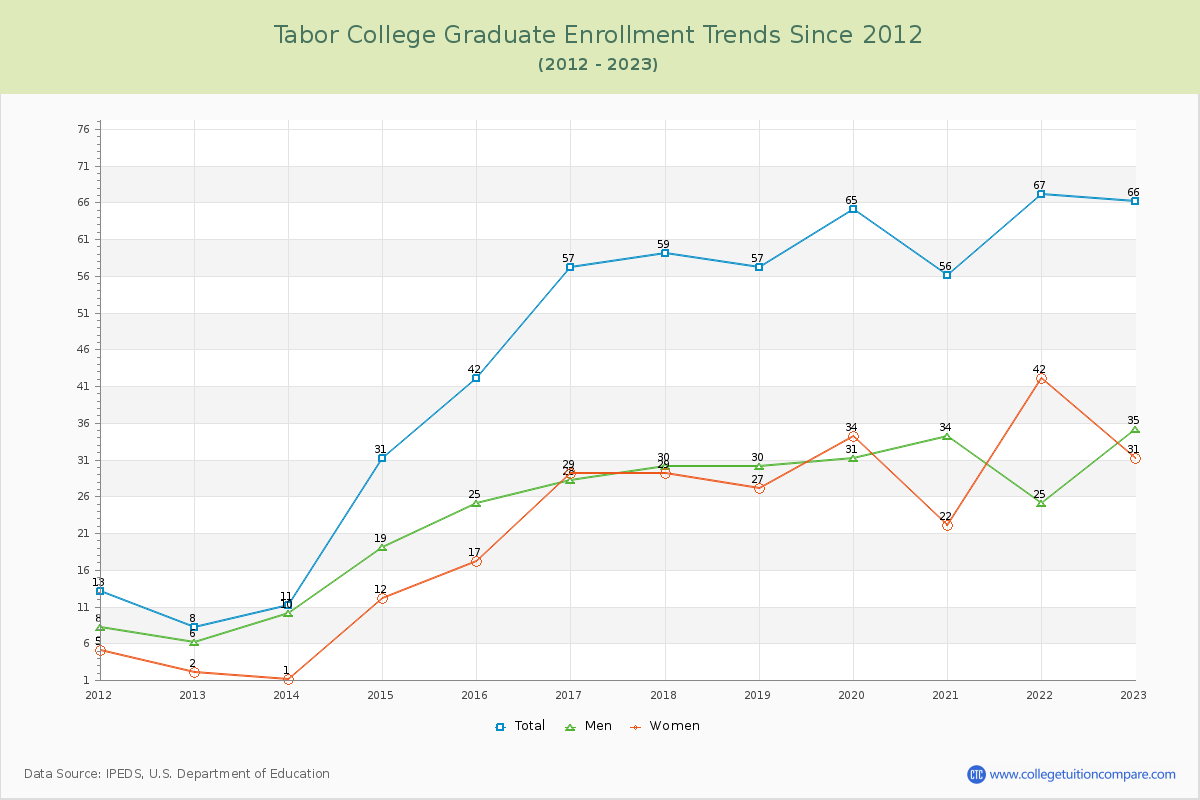
89.64% of total students is undergraduate students and 10.36% students is graduate students. The number of undergraduate students has decreased by 189 and the graduate enrollment has increased by 58 over past 10 years.
The female to male ratio is 0.73 to 1 and it means that there are more male students enrolled in TC than female students.
The following table and chart illustrate the changes in student population by gender at Tabor College since 2012.
| Year | Total | Undergraduate | Graduate | ||||
|---|---|---|---|---|---|---|---|
| Total | Men | Women | Total | Men | Women | ||
| 2012-13 | 768 | 760 | 395 | 365 | 8 | 6 | 2 |
| 2013-14 | 736 -32 | 725 -35 | 376 -19 | 349 -16 | 11 3 | 10 4 | 1 -1 |
| 2014-15 | 766 30 | 735 10 | 368 -8 | 367 18 | 31 20 | 19 9 | 12 11 |
| 2015-16 | 729 -37 | 687 -48 | 357 -11 | 330 -37 | 42 11 | 25 6 | 17 5 |
| 2016-17 | 727 -2 | 670 -17 | 359 2 | 311 -19 | 57 15 | 28 3 | 29 12 |
| 2017-18 | 770 43 | 711 41 | 384 25 | 327 16 | 59 2 | 30 2 | 29 0 |
| 2018-19 | 713 -57 | 656 -55 | 366 -18 | 290 -37 | 57 -2 | 30 0 | 27 -2 |
| 2019-20 | 642 -71 | 577 -79 | 333 -33 | 244 -46 | 65 8 | 31 1 | 34 7 |
| 2020-21 | 642 0 | 586 9 | 352 19 | 234 -10 | 56 -9 | 34 3 | 22 -12 |
| 2021-22 | 688 46 | 621 35 | 375 23 | 246 12 | 67 11 | 25 -9 | 42 20 |
| 2022-23 | 637 -51 | 571 -50 | 334 -41 | 237 -9 | 66 -1 | 35 10 | 31 -11 |
| Average | 711 | 664 | 364 | 300 | 47 | 25 | 22 |