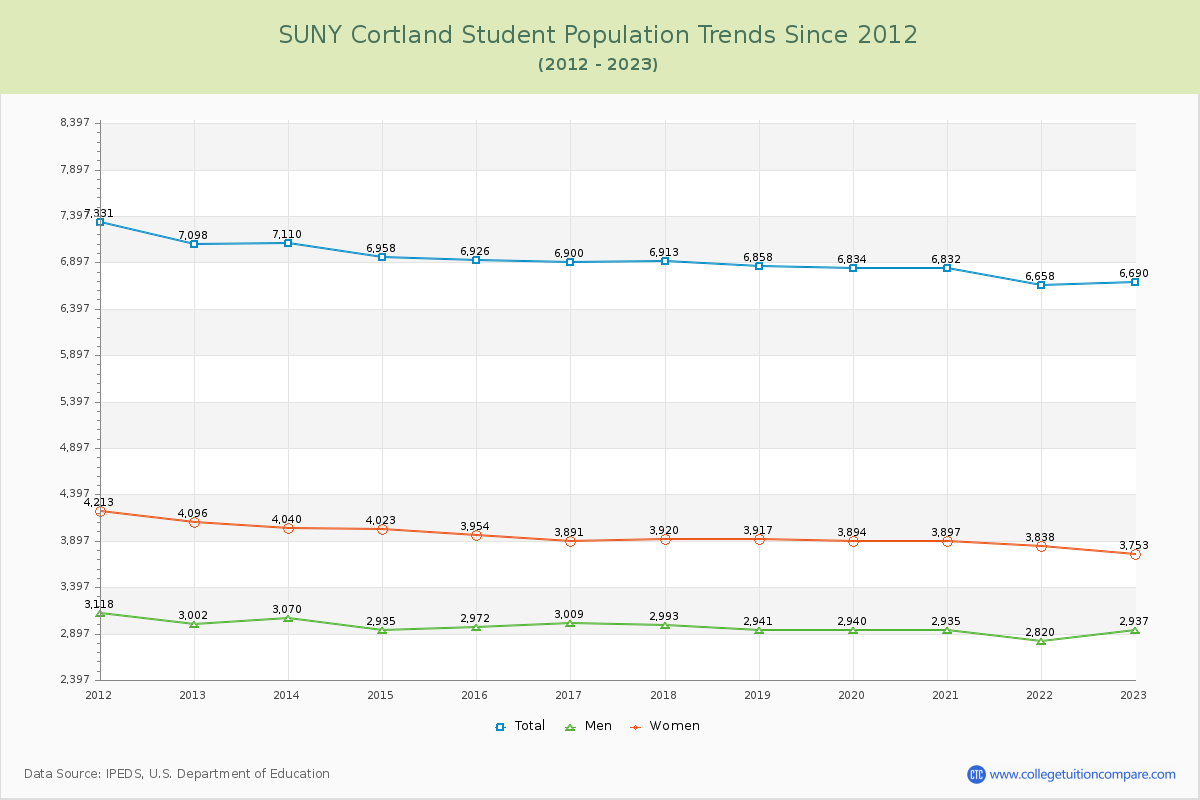
Student Population Changes
The average student population over the last 12 years is 6,889 where 6,690 students are attending the school for the academic year 2022-2023.
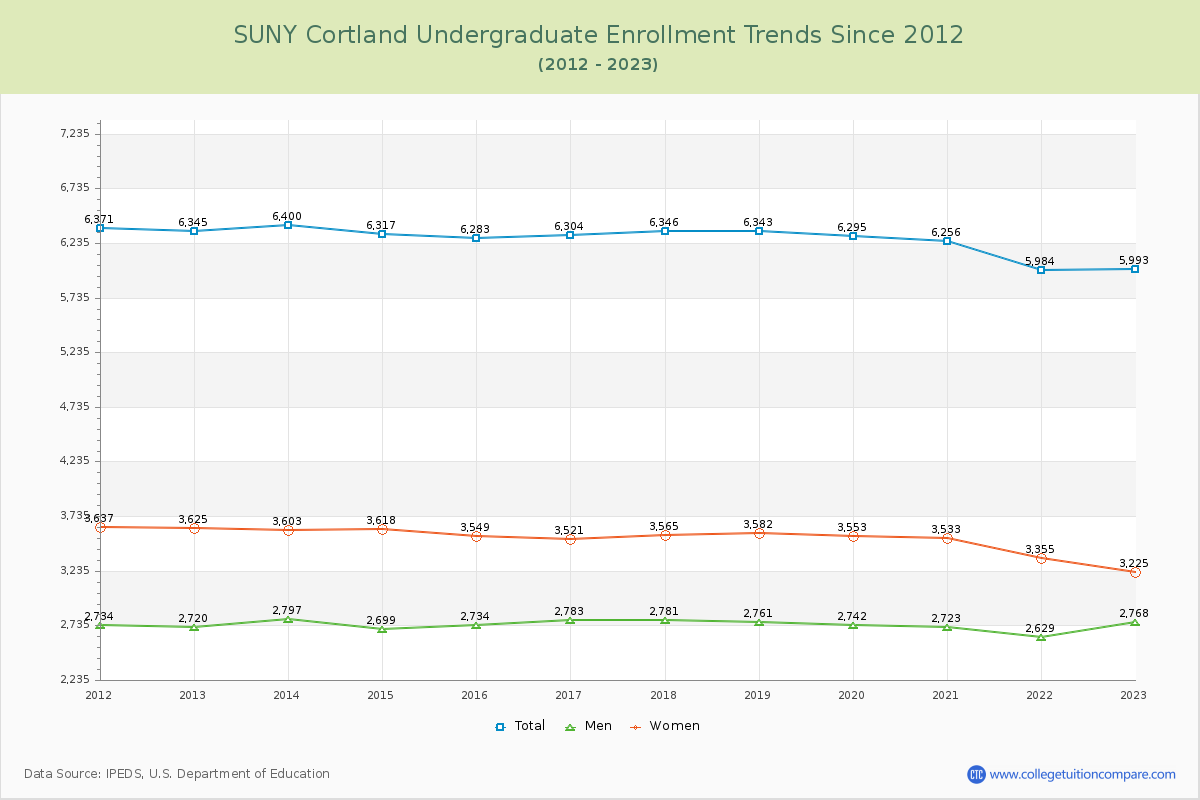
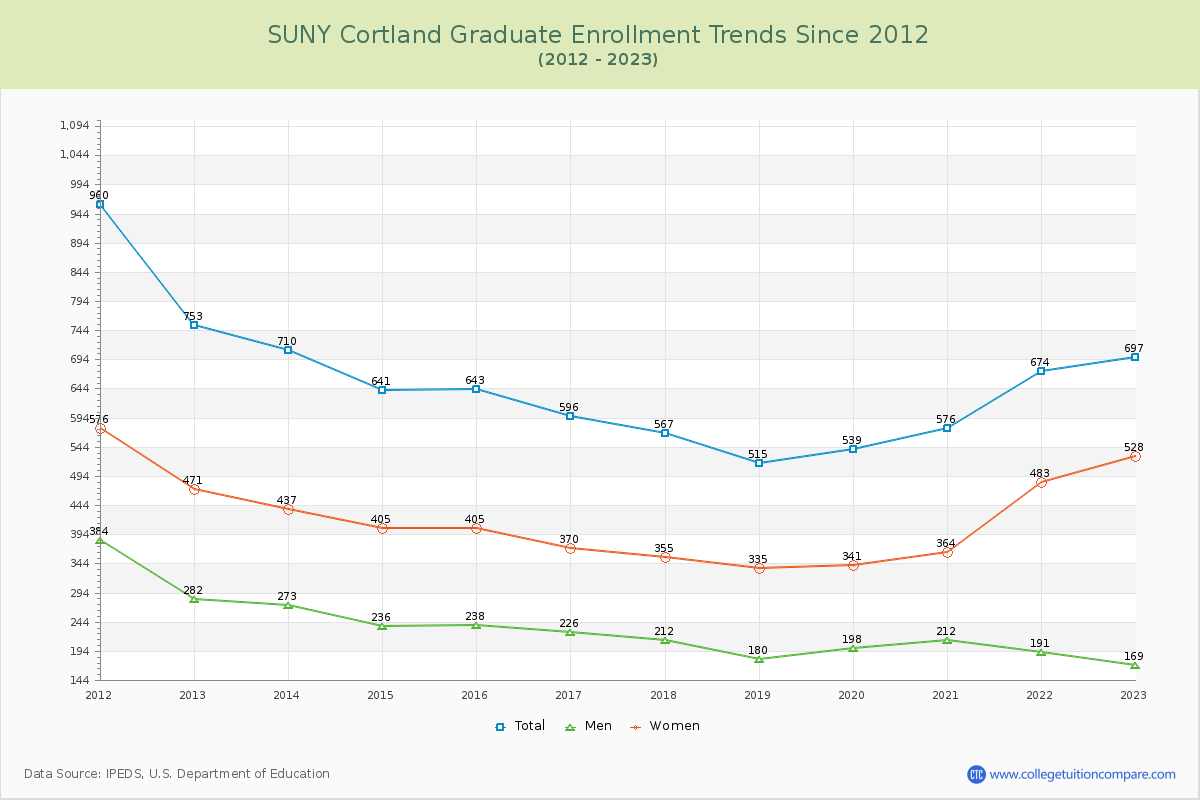
89.58% of total students is undergraduate students and 10.42% students is graduate students. The number of undergraduate students has decreased by 352 and the graduate enrollment has decreased by 56 over past 10 years.
The female to male ratio is 1.28 to 1 and it means that there are slightly more female students enrolled in SUNY Cortland than male students.
The following table and chart illustrate the changes in student population by gender at SUNY Cortland since 2012.
| Year | Total | Undergraduate | Graduate | ||||
|---|---|---|---|---|---|---|---|
| Total | Men | Women | Total | Men | Women | ||
| 2012-13 | 7,098 | 6,345 | 2,720 | 3,625 | 753 | 282 | 471 |
| 2013-14 | 7,110 12 | 6,400 55 | 2,797 77 | 3,603 -22 | 710 -43 | 273 -9 | 437 -34 |
| 2014-15 | 6,958 -152 | 6,317 -83 | 2,699 -98 | 3,618 15 | 641 -69 | 236 -37 | 405 -32 |
| 2015-16 | 6,926 -32 | 6,283 -34 | 2,734 35 | 3,549 -69 | 643 2 | 238 2 | 405 0 |
| 2016-17 | 6,900 -26 | 6,304 21 | 2,783 49 | 3,521 -28 | 596 -47 | 226 -12 | 370 -35 |
| 2017-18 | 6,913 13 | 6,346 42 | 2,781 -2 | 3,565 44 | 567 -29 | 212 -14 | 355 -15 |
| 2018-19 | 6,858 -55 | 6,343 -3 | 2,761 -20 | 3,582 17 | 515 -52 | 180 -32 | 335 -20 |
| 2019-20 | 6,834 -24 | 6,295 -48 | 2,742 -19 | 3,553 -29 | 539 24 | 198 18 | 341 6 |
| 2020-21 | 6,832 -2 | 6,256 -39 | 2,723 -19 | 3,533 -20 | 576 37 | 212 14 | 364 23 |
| 2021-22 | 6,658 -174 | 5,984 -272 | 2,629 -94 | 3,355 -178 | 674 98 | 191 -21 | 483 119 |
| 2022-23 | 6,690 32 | 5,993 9 | 2,768 139 | 3,225 -130 | 697 23 | 169 -22 | 528 45 |
| Average | 6,889 | 6,261 | 2,740 | 3,521 | 628 | 220 | 409 |