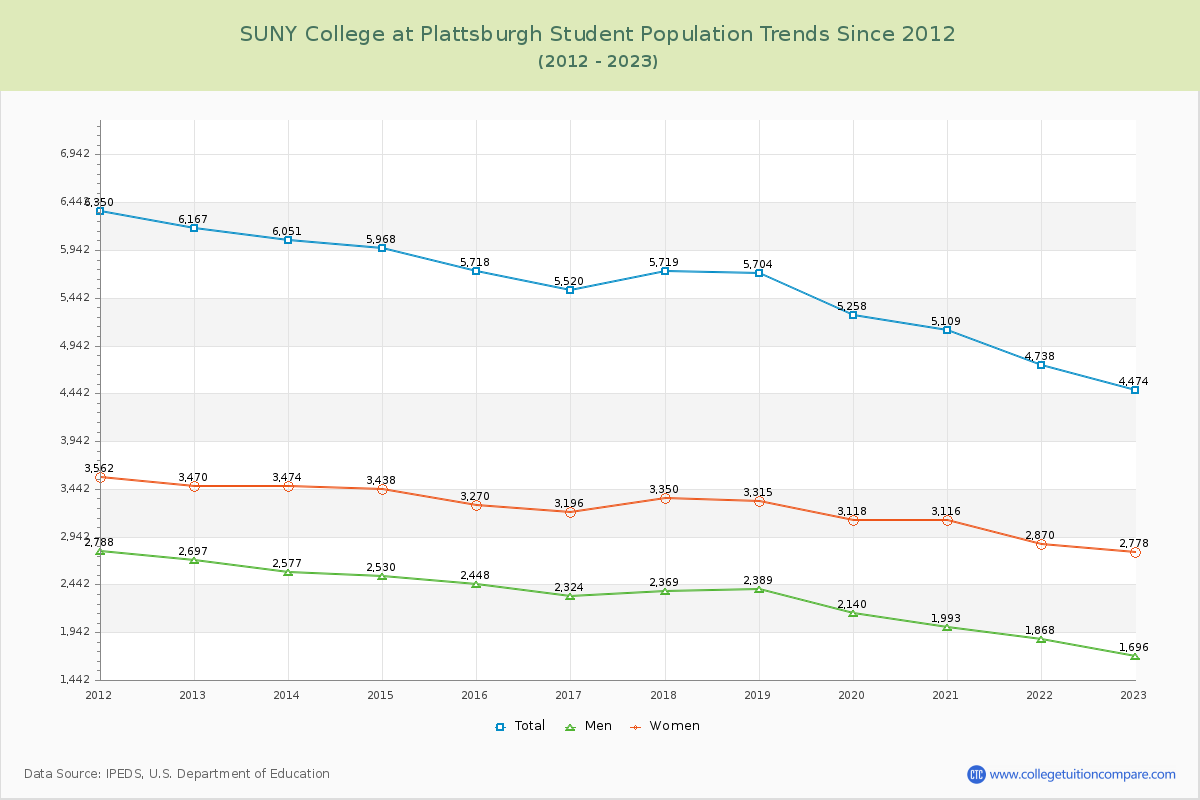
Student Population Changes
The average student population over the last 12 years is 5,493 where 4,474 students are attending the school for the academic year 2022-2023.
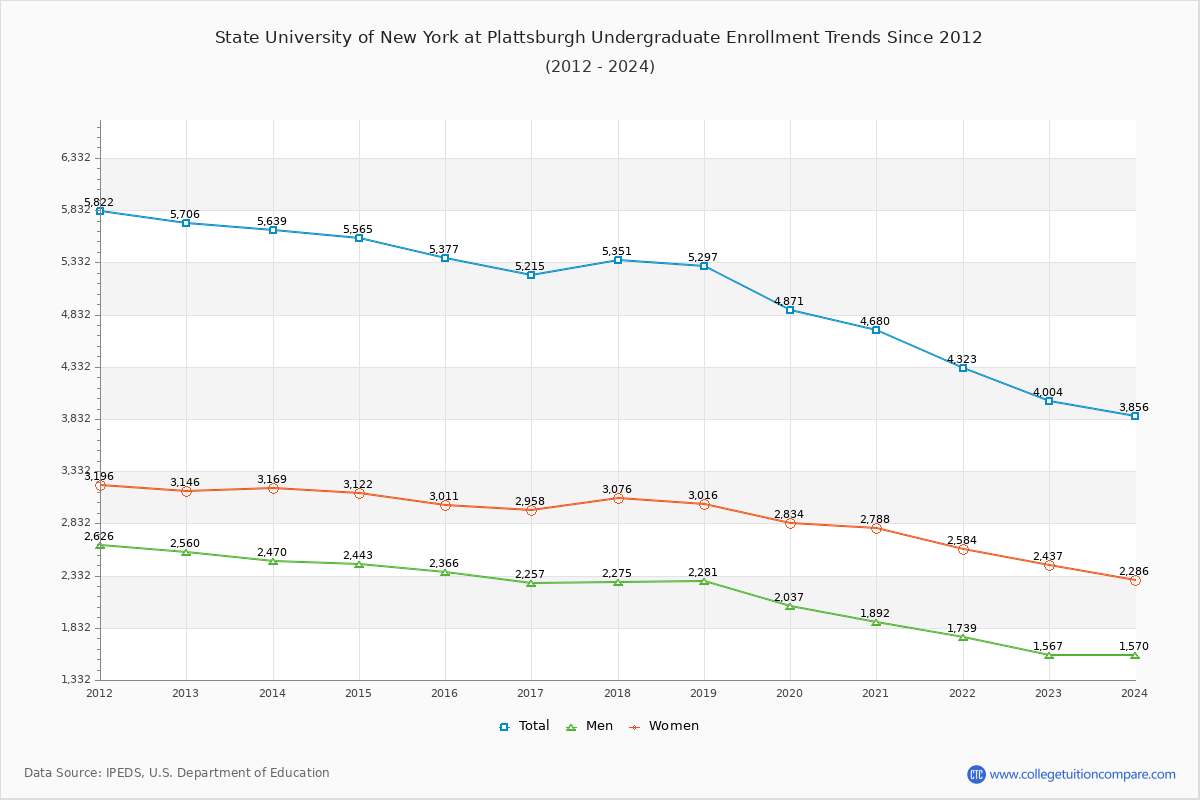
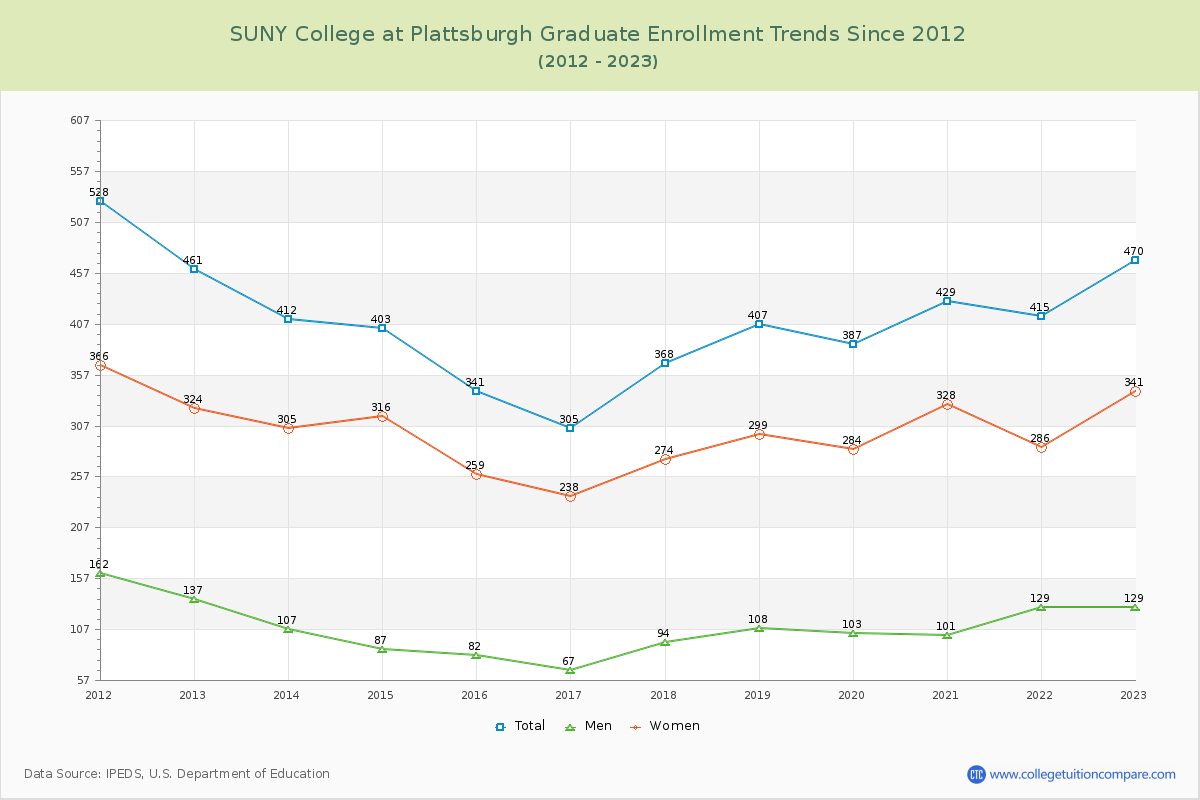
89.49% of total students is undergraduate students and 10.51% students is graduate students. The number of undergraduate students has decreased by 1,702 and the graduate enrollment has increased by 9 over past 10 years.
The female to male ratio is 1.64 to 1 and it means that there are more female students enrolled in SUNY College at Plattsburgh than male students.
The following table and chart illustrate the changes in student population by gender at SUNY College at Plattsburgh since 2012.
| Year | Total | Undergraduate | Graduate | ||||
|---|---|---|---|---|---|---|---|
| Total | Men | Women | Total | Men | Women | ||
| 2012-13 | 6,167 | 5,706 | 2,560 | 3,146 | 461 | 137 | 324 |
| 2013-14 | 6,051 -116 | 5,639 -67 | 2,470 -90 | 3,169 23 | 412 -49 | 107 -30 | 305 -19 |
| 2014-15 | 5,968 -83 | 5,565 -74 | 2,443 -27 | 3,122 -47 | 403 -9 | 87 -20 | 316 11 |
| 2015-16 | 5,718 -250 | 5,377 -188 | 2,366 -77 | 3,011 -111 | 341 -62 | 82 -5 | 259 -57 |
| 2016-17 | 5,520 -198 | 5,215 -162 | 2,257 -109 | 2,958 -53 | 305 -36 | 67 -15 | 238 -21 |
| 2017-18 | 5,719 199 | 5,351 136 | 2,275 18 | 3,076 118 | 368 63 | 94 27 | 274 36 |
| 2018-19 | 5,704 -15 | 5,297 -54 | 2,281 6 | 3,016 -60 | 407 39 | 108 14 | 299 25 |
| 2019-20 | 5,258 -446 | 4,871 -426 | 2,037 -244 | 2,834 -182 | 387 -20 | 103 -5 | 284 -15 |
| 2020-21 | 5,109 -149 | 4,680 -191 | 1,892 -145 | 2,788 -46 | 429 42 | 101 -2 | 328 44 |
| 2021-22 | 4,738 -371 | 4,323 -357 | 1,739 -153 | 2,584 -204 | 415 -14 | 129 28 | 286 -42 |
| 2022-23 | 4,474 -264 | 4,004 -319 | 1,567 -172 | 2,437 -147 | 470 55 | 129 0 | 341 55 |
| Average | 5,493 | 5,093 | 2,172 | 2,922 | 400 | 104 | 296 |