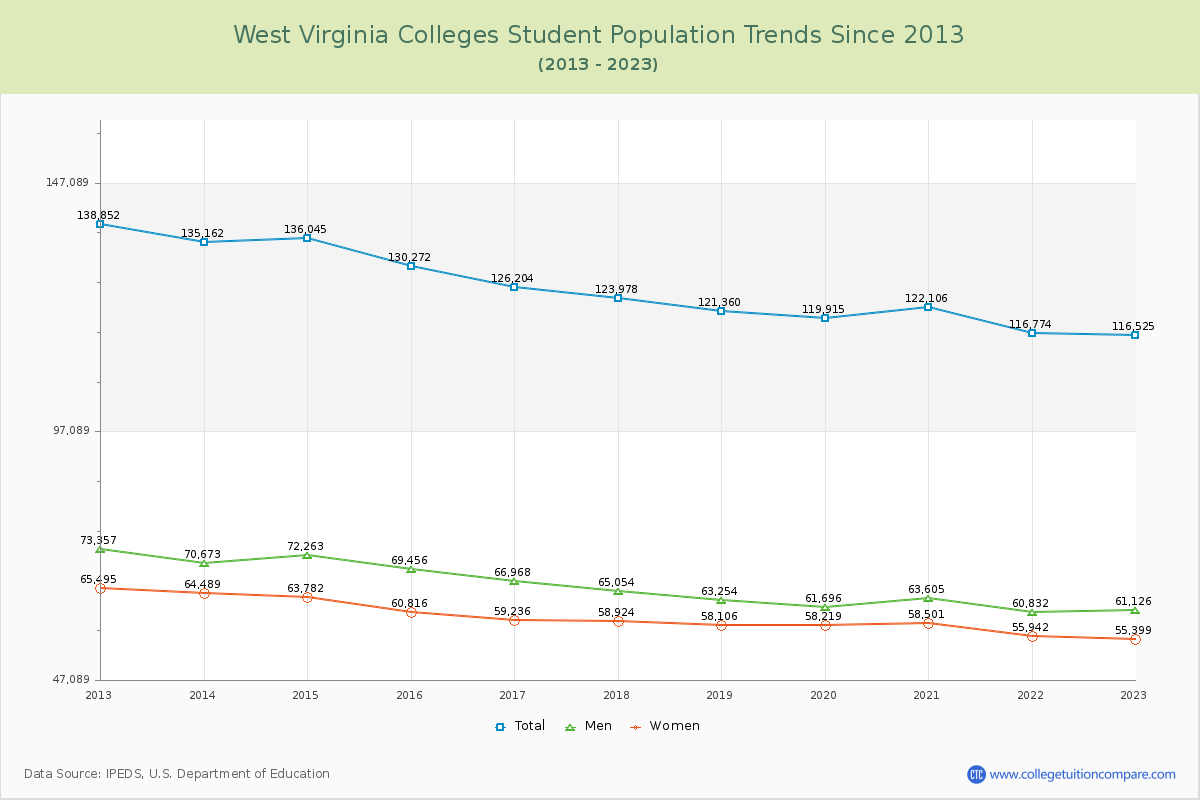
Student Population Changes
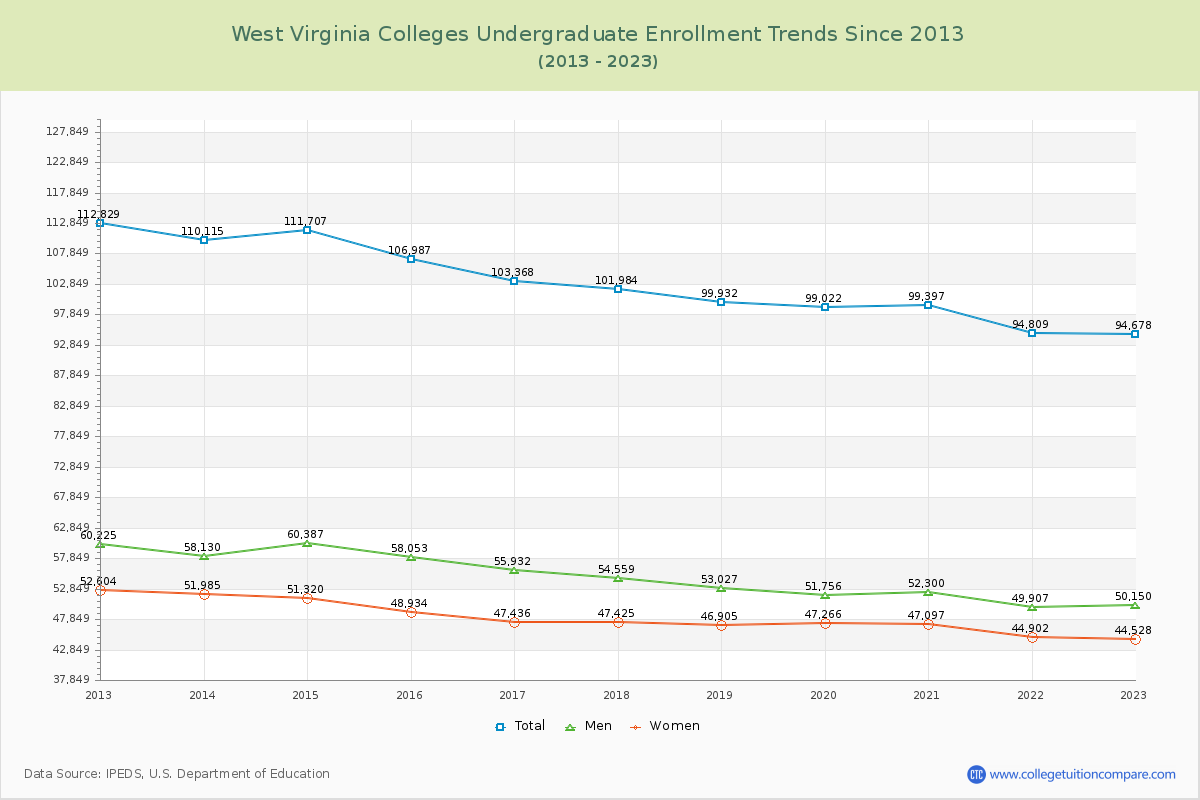
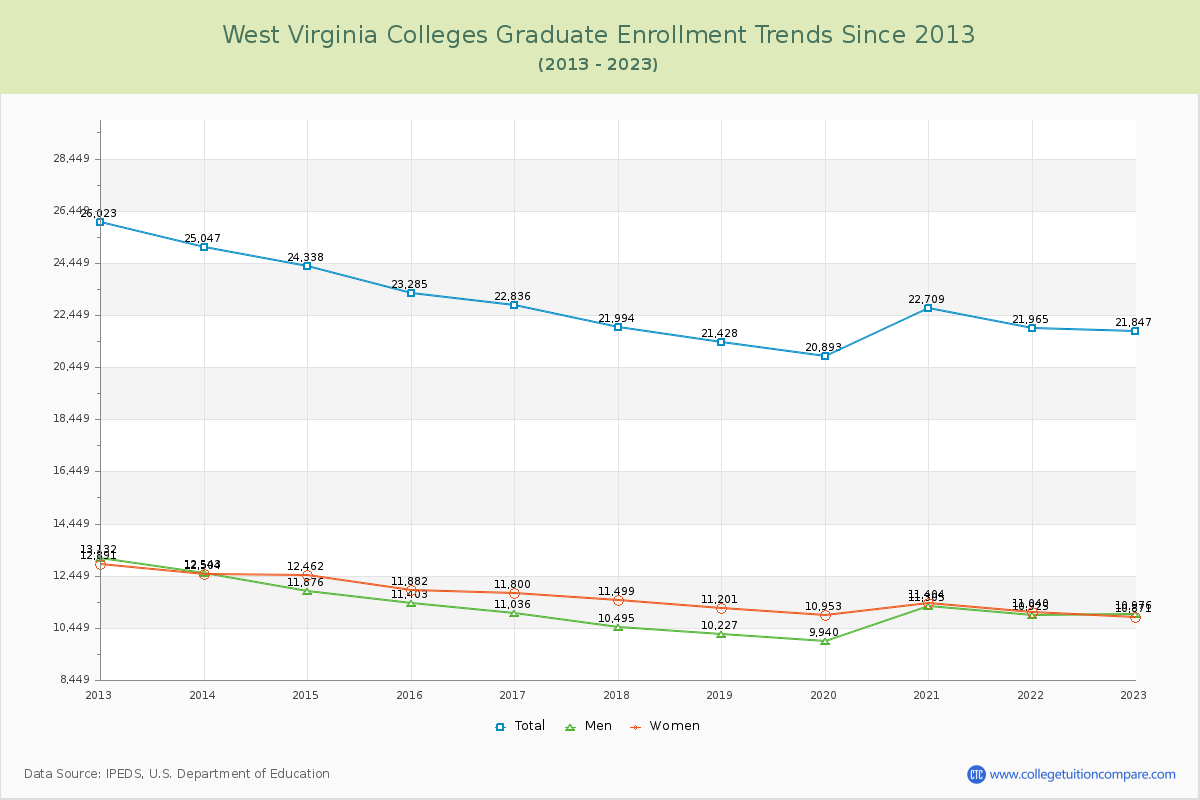
The average number of students over the past 11 years is 126,108, and 116,525 students were attending the schools in the academic year 2022-2023. Of the total students, 81.25% are undergraduate students and 18.75% are graduate students. Over the past 11, the number of undergraduate students decreased by 18,151, and the graduate student enrollment decreased by 4,176.
The female to male ratio is 0.91 to 1, meaning that there are similar numbers of female and male students enrolled in West Virginia Colleges.
The following table and chart illustrate the changes in student population by gender at West Virginia Colleges since 2013.
| Year | Total | Undergraduate | Graduate | ||||
|---|---|---|---|---|---|---|---|
| Total | Men | Women | Total | Men | Women | ||
| 2012-13 | 138,852 | 112,829 | 60,225 | 52,604 | 26,023 | 13,132 | 12,891 |
| 2013-14 | 135,162 -3,690 | 110,115 -2,714 | 58,130 -2,095 | 51,985 -619 | 25,047 -976 | 12,543 -589 | 12,504 -387 |
| 2014-15 | 136,045 883 | 111,707 1,592 | 60,387 2,257 | 51,320 -665 | 24,338 -709 | 11,876 -667 | 12,462 -42 |
| 2015-16 | 130,272 -5,773 | 106,987 -4,720 | 58,053 -2,334 | 48,934 -2,386 | 23,285 -1,053 | 11,403 -473 | 11,882 -580 |
| 2016-17 | 126,204 -4,068 | 103,368 -3,619 | 55,932 -2,121 | 47,436 -1,498 | 22,836 -449 | 11,036 -367 | 11,800 -82 |
| 2017-18 | 123,978 -2,226 | 101,984 -1,384 | 54,559 -1,373 | 47,425 -11 | 21,994 -842 | 10,495 -541 | 11,499 -301 |
| 2018-19 | 121,360 -2,618 | 99,932 -2,052 | 53,027 -1,532 | 46,905 -520 | 21,428 -566 | 10,227 -268 | 11,201 -298 |
| 2019-20 | 119,915 -1,445 | 99,022 -910 | 51,756 -1,271 | 47,266 361 | 20,893 -535 | 9,940 -287 | 10,953 -248 |
| 2020-21 | 122,106 2,191 | 99,397 375 | 52,300 544 | 47,097 -169 | 22,709 1,816 | 11,305 1,365 | 11,404 451 |
| 2021-22 | 116,774 -5,332 | 94,809 -4,588 | 49,907 -2,393 | 44,902 -2,195 | 21,965 -744 | 10,925 -380 | 11,040 -364 |
| 2022-23 | 116,525 -249 | 94,678 -131 | 50,150 243 | 44,528 -374 | 21,847 -118 | 10,976 51 | 10,871 -169 |
| Average | 126,108 | 103,166 | 54,948 | 48,218 | 22,942 | 11,260 | 11,682 |