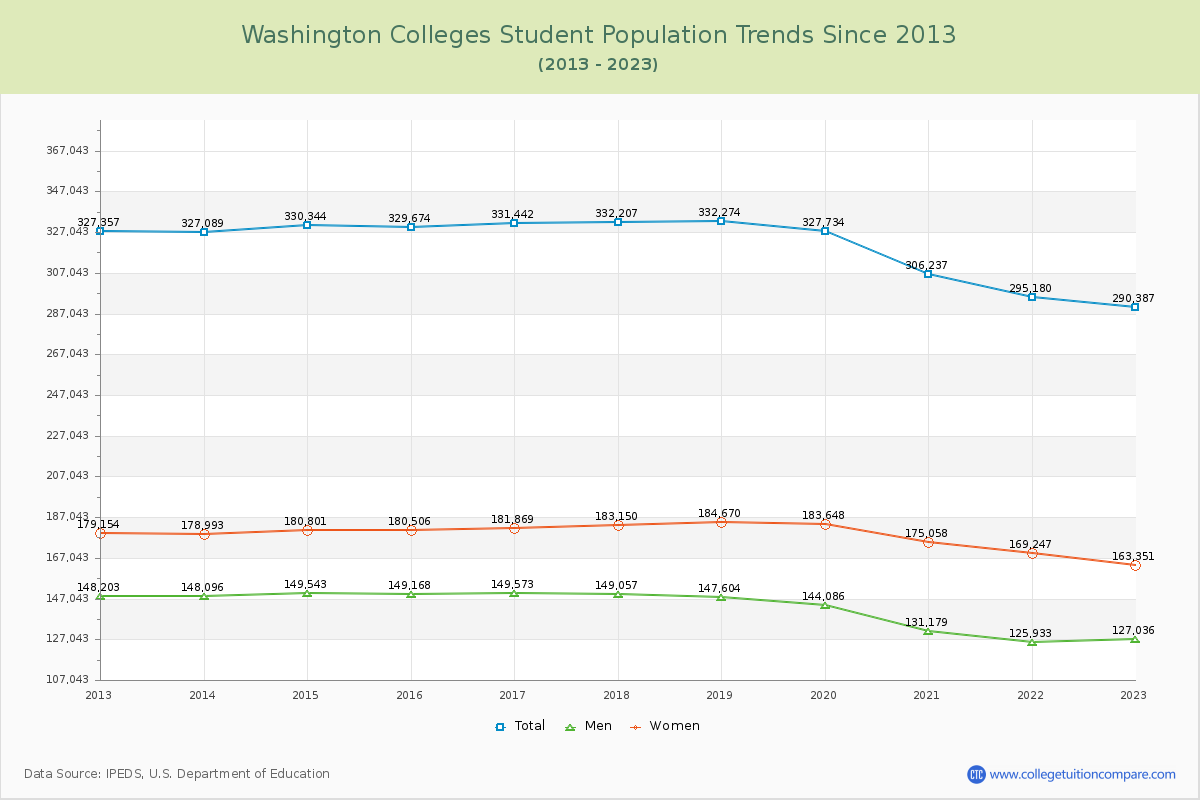
Student Population Changes
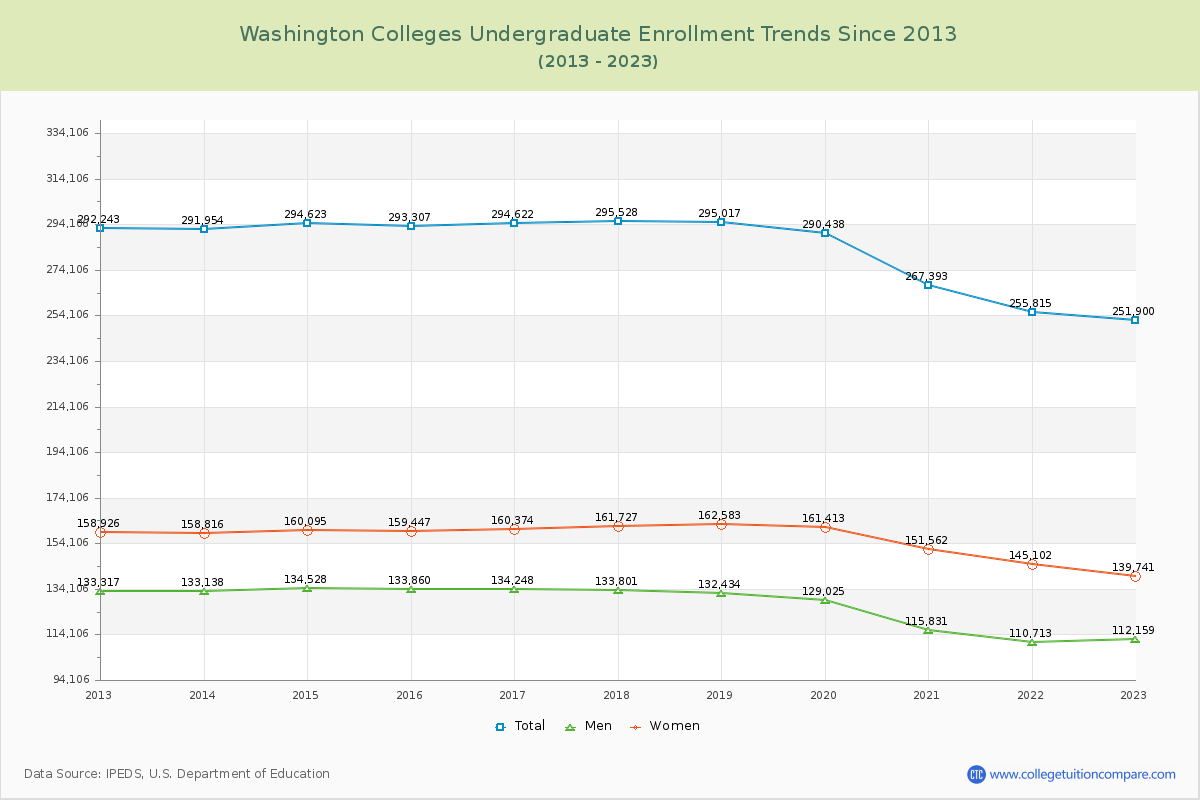
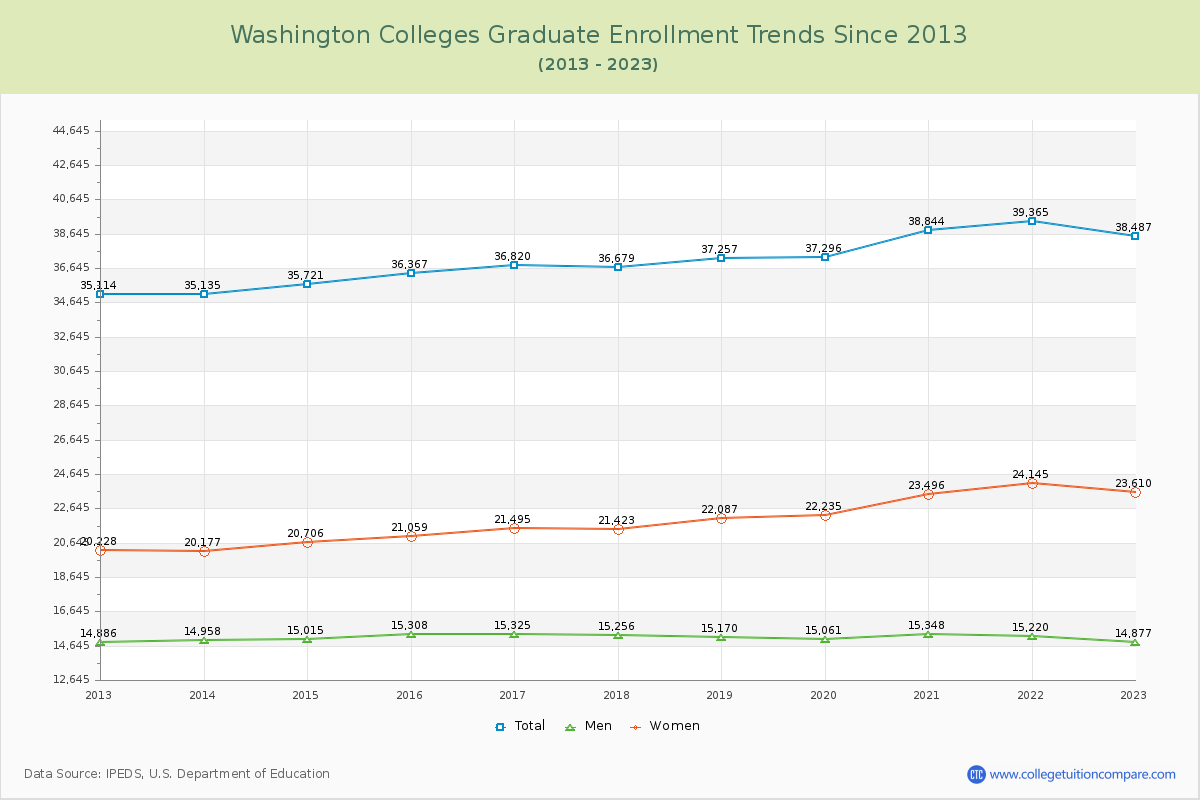
The average number of students over the past 11 years is 320,902, and 290,387 students were attending the schools in the academic year 2022-2023. Of the total students, 86.75% are undergraduate students and 13.25% are graduate students. Over the past 11, the number of undergraduate students decreased by 40,343, and the graduate student enrollment increased by 3,373.
The female to male ratio is 1.29 to 1, meaning that there are slightly more female students enrolled in Washington Colleges than male students.
The following table and chart illustrate the changes in student population by gender at Washington Colleges since 2013.
| Year | Total | Undergraduate | Graduate | ||||
|---|---|---|---|---|---|---|---|
| Total | Men | Women | Total | Men | Women | ||
| 2012-13 | 327,357 | 292,243 | 133,317 | 158,926 | 35,114 | 14,886 | 20,228 |
| 2013-14 | 327,089 -268 | 291,954 -289 | 133,138 -179 | 158,816 -110 | 35,135 21 | 14,958 72 | 20,177 -51 |
| 2014-15 | 330,344 3,255 | 294,623 2,669 | 134,528 1,390 | 160,095 1,279 | 35,721 586 | 15,015 57 | 20,706 529 |
| 2015-16 | 329,674 -670 | 293,307 -1,316 | 133,860 -668 | 159,447 -648 | 36,367 646 | 15,308 293 | 21,059 353 |
| 2016-17 | 331,442 1,768 | 294,622 1,315 | 134,248 388 | 160,374 927 | 36,820 453 | 15,325 17 | 21,495 436 |
| 2017-18 | 332,207 765 | 295,528 906 | 133,801 -447 | 161,727 1,353 | 36,679 -141 | 15,256 -69 | 21,423 -72 |
| 2018-19 | 332,274 67 | 295,017 -511 | 132,434 -1,367 | 162,583 856 | 37,257 578 | 15,170 -86 | 22,087 664 |
| 2019-20 | 327,734 -4,540 | 290,438 -4,579 | 129,025 -3,409 | 161,413 -1,170 | 37,296 39 | 15,061 -109 | 22,235 148 |
| 2020-21 | 306,237 -21,497 | 267,393 -23,045 | 115,831 -13,194 | 151,562 -9,851 | 38,844 1,548 | 15,348 287 | 23,496 1,261 |
| 2021-22 | 295,180 -11,057 | 255,815 -11,578 | 110,713 -5,118 | 145,102 -6,460 | 39,365 521 | 15,220 -128 | 24,145 649 |
| 2022-23 | 290,387 -4,793 | 251,900 -3,915 | 112,159 1,446 | 139,741 -5,361 | 38,487 -878 | 14,877 -343 | 23,610 -535 |
| Average | 320,902 | 283,895 | 127,550 | 156,344 | 37,008 | 15,129 | 21,878 |