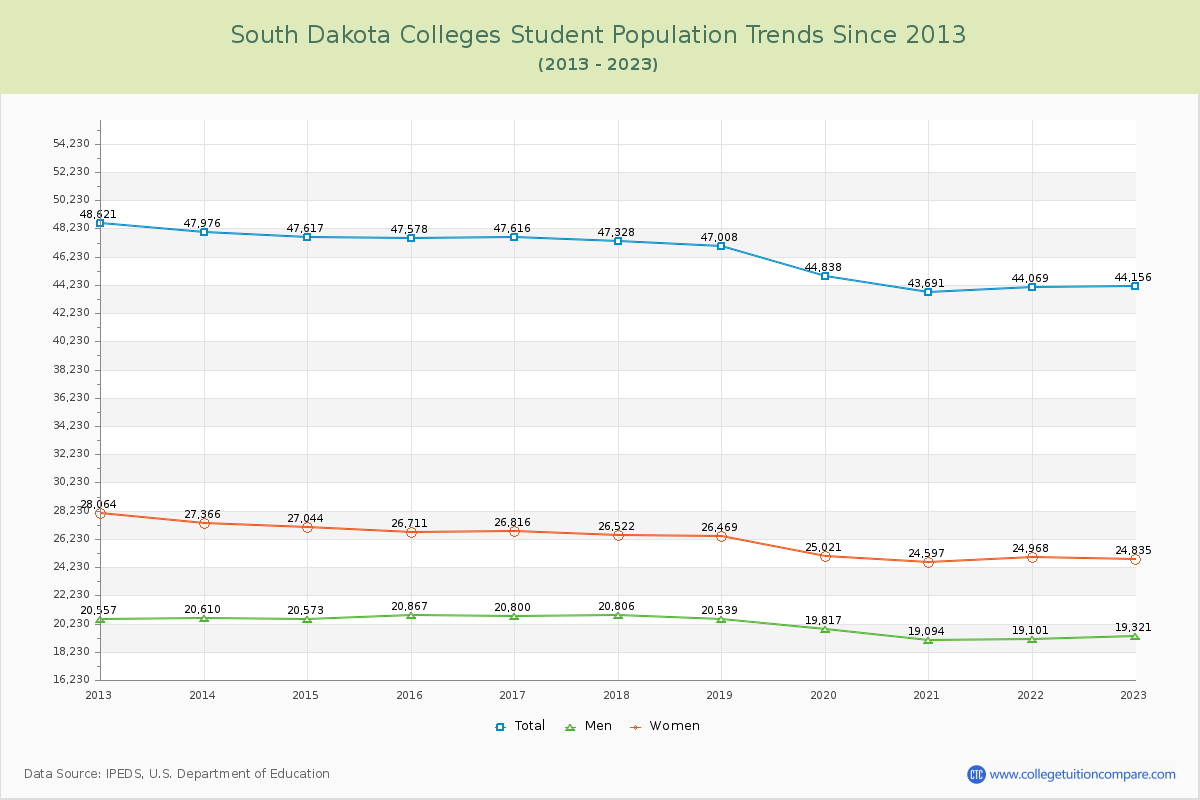
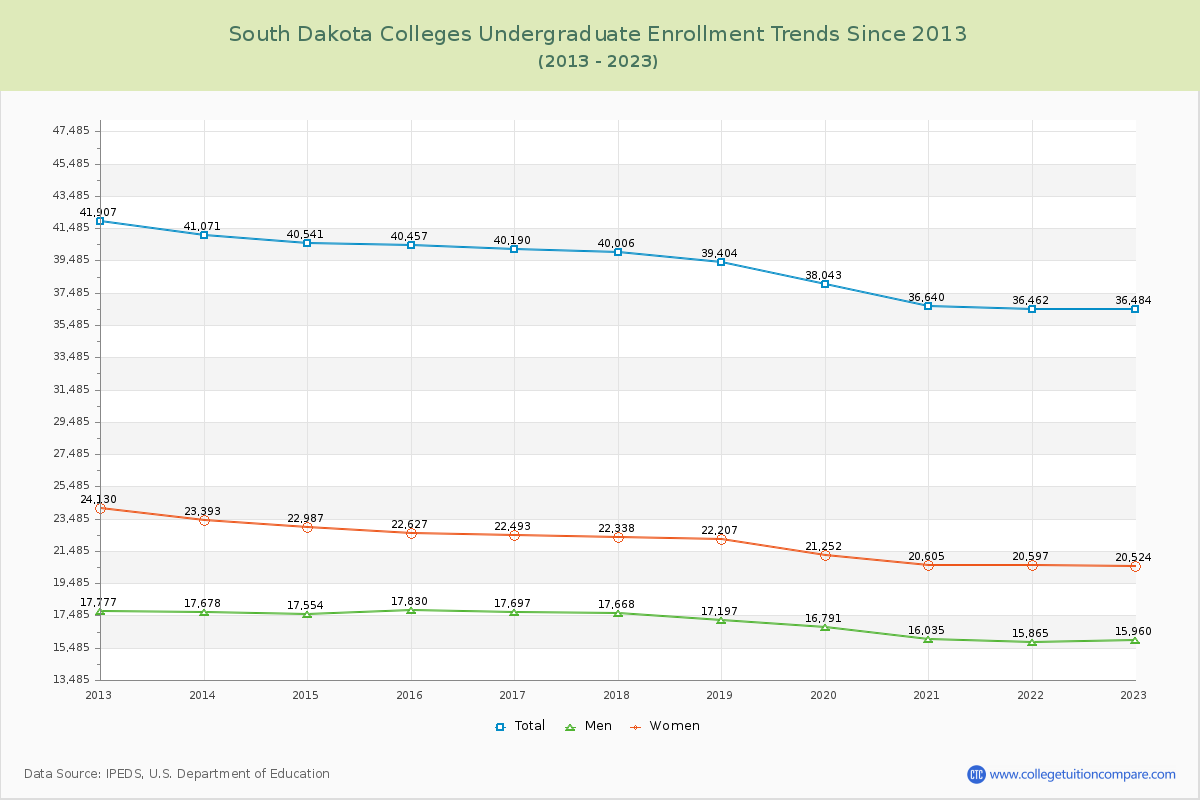
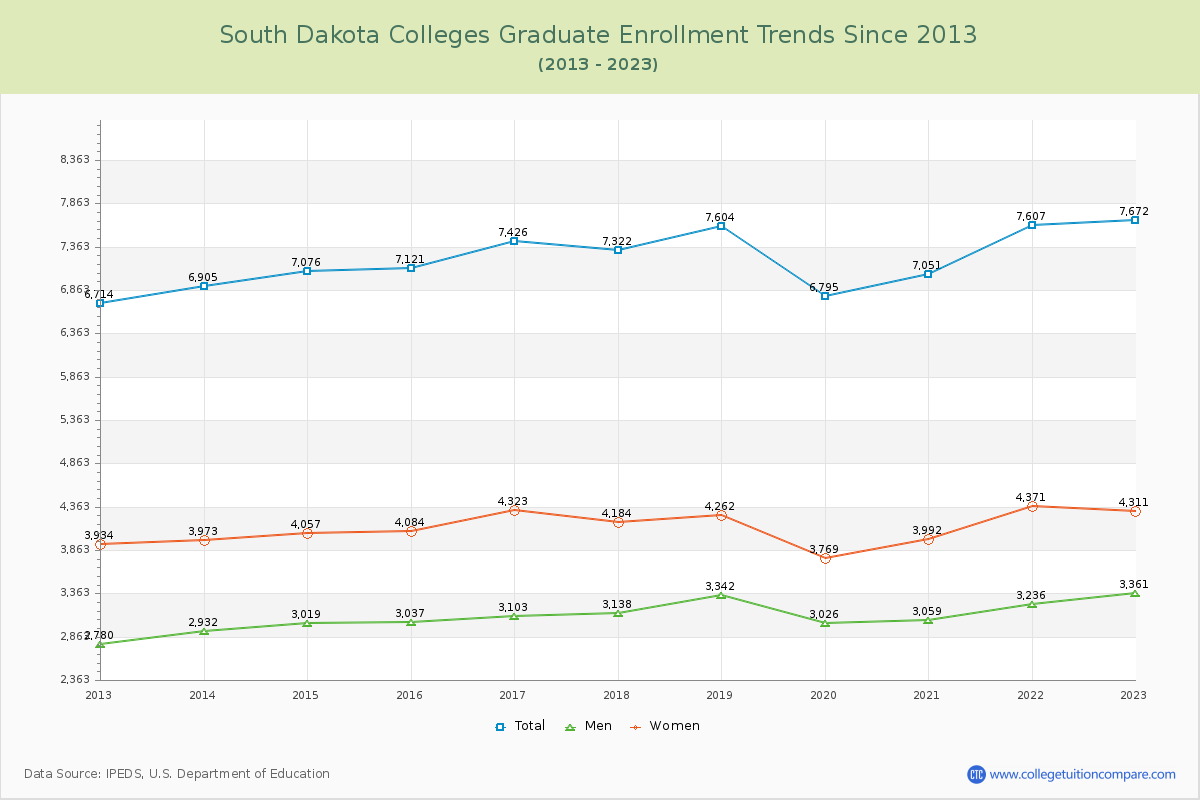
Student Population Changes
The average number of students over the past 11 years is 46,409, and 44,156 students were attending the schools in the academic year 2022-2023. Of the total students, 82.63% are undergraduate students and 17.37% are graduate students. Over the past 11, the number of undergraduate students decreased by 5,423, and the graduate student enrollment increased by 958.
The female to male ratio is 1.29 to 1, meaning that there are slightly more female students enrolled in South Dakota Colleges than male students.
The following table and chart illustrate the changes in student population by gender at South Dakota Colleges since 2013.
| Year | Total | Undergraduate | Graduate | ||||
|---|---|---|---|---|---|---|---|
| Total | Men | Women | Total | Men | Women | ||
| 2012-13 | 48,621 | 41,907 | 17,777 | 24,130 | 6,714 | 2,780 | 3,934 |
| 2013-14 | 47,976 -645 | 41,071 -836 | 17,678 -99 | 23,393 -737 | 6,905 191 | 2,932 152 | 3,973 39 |
| 2014-15 | 47,617 -359 | 40,541 -530 | 17,554 -124 | 22,987 -406 | 7,076 171 | 3,019 87 | 4,057 84 |
| 2015-16 | 47,578 -39 | 40,457 -84 | 17,830 276 | 22,627 -360 | 7,121 45 | 3,037 18 | 4,084 27 |
| 2016-17 | 47,616 38 | 40,190 -267 | 17,697 -133 | 22,493 -134 | 7,426 305 | 3,103 66 | 4,323 239 |
| 2017-18 | 47,328 -288 | 40,006 -184 | 17,668 -29 | 22,338 -155 | 7,322 -104 | 3,138 35 | 4,184 -139 |
| 2018-19 | 47,008 -320 | 39,404 -602 | 17,197 -471 | 22,207 -131 | 7,604 282 | 3,342 204 | 4,262 78 |
| 2019-20 | 44,838 -2,170 | 38,043 -1,361 | 16,791 -406 | 21,252 -955 | 6,795 -809 | 3,026 -316 | 3,769 -493 |
| 2020-21 | 43,691 -1,147 | 36,640 -1,403 | 16,035 -756 | 20,605 -647 | 7,051 256 | 3,059 33 | 3,992 223 |
| 2021-22 | 44,069 378 | 36,462 -178 | 15,865 -170 | 20,597 -8 | 7,607 556 | 3,236 177 | 4,371 379 |
| 2022-23 | 44,156 87 | 36,484 22 | 15,960 95 | 20,524 -73 | 7,672 65 | 3,361 125 | 4,311 -60 |
| Average | 46,409 | 39,200 | 17,096 | 22,105 | 7,208 | 3,094 | 4,115 |