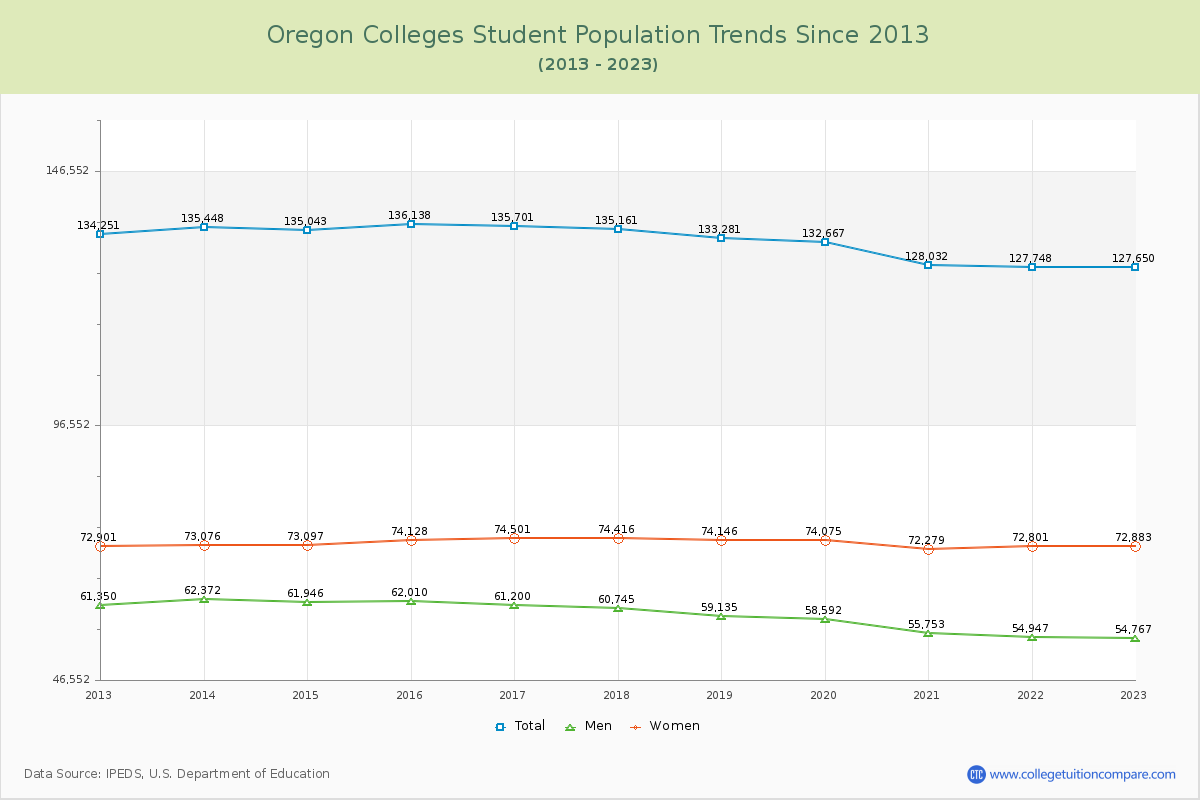
Student Population Changes
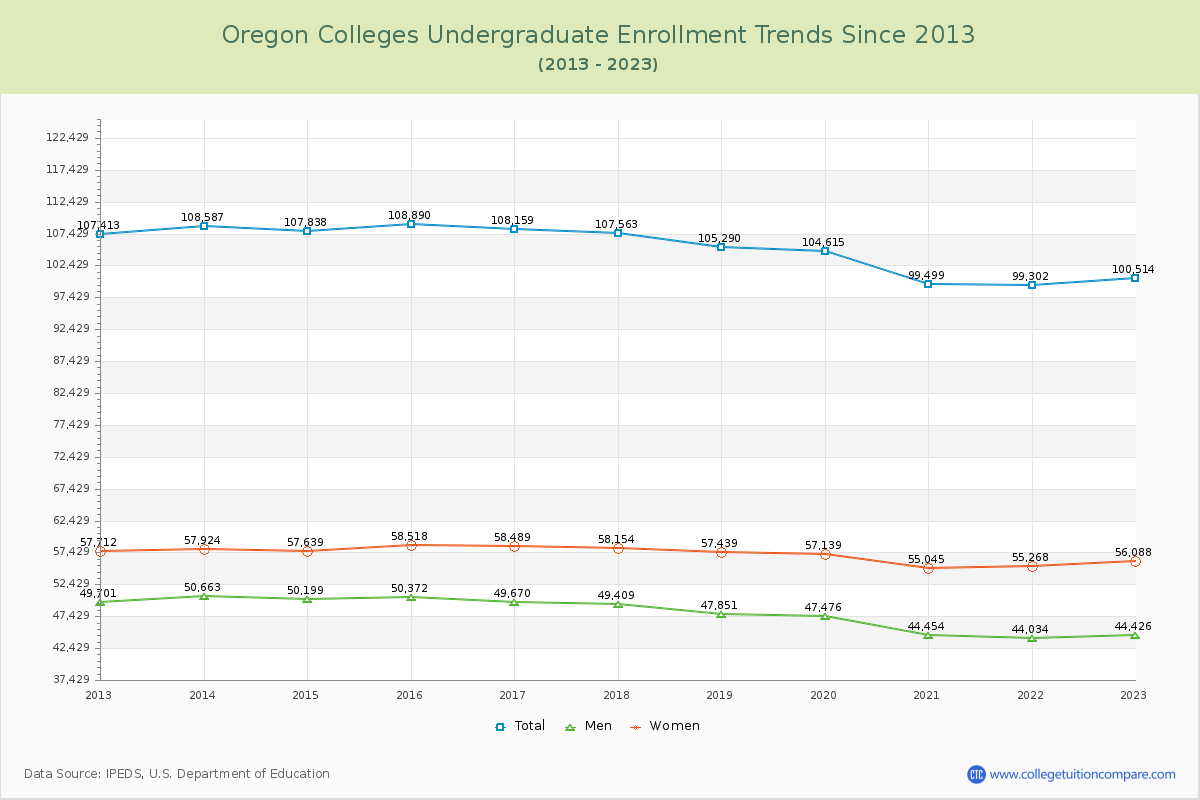
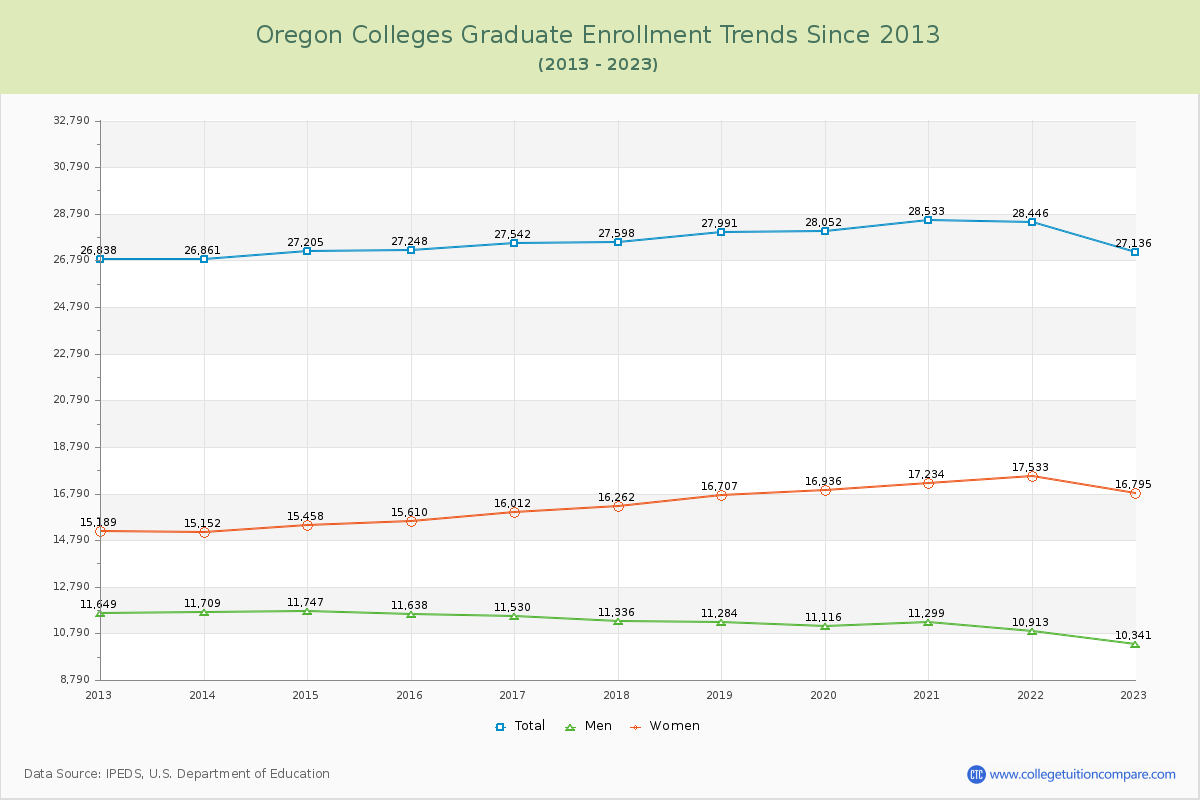
The average number of students over the past 11 years is 132,829, and 127,650 students were attending the schools in the academic year 2022-2023. Of the total students, 78.74% are undergraduate students and 21.26% are graduate students. Over the past 11, the number of undergraduate students decreased by 6,899, and the graduate student enrollment increased by 298.
The female to male ratio is 1.33 to 1, meaning that there are more female students enrolled in Oregon Colleges than male students.
The following table and chart illustrate the changes in student population by gender at Oregon Colleges since 2013.
| Year | Total | Undergraduate | Graduate | ||||
|---|---|---|---|---|---|---|---|
| Total | Men | Women | Total | Men | Women | ||
| 2012-13 | 134,251 | 107,413 | 49,701 | 57,712 | 26,838 | 11,649 | 15,189 |
| 2013-14 | 135,448 1,197 | 108,587 1,174 | 50,663 962 | 57,924 212 | 26,861 23 | 11,709 60 | 15,152 -37 |
| 2014-15 | 135,043 -405 | 107,838 -749 | 50,199 -464 | 57,639 -285 | 27,205 344 | 11,747 38 | 15,458 306 |
| 2015-16 | 136,138 1,095 | 108,890 1,052 | 50,372 173 | 58,518 879 | 27,248 43 | 11,638 -109 | 15,610 152 |
| 2016-17 | 135,701 -437 | 108,159 -731 | 49,670 -702 | 58,489 -29 | 27,542 294 | 11,530 -108 | 16,012 402 |
| 2017-18 | 135,161 -540 | 107,563 -596 | 49,409 -261 | 58,154 -335 | 27,598 56 | 11,336 -194 | 16,262 250 |
| 2018-19 | 133,281 -1,880 | 105,290 -2,273 | 47,851 -1,558 | 57,439 -715 | 27,991 393 | 11,284 -52 | 16,707 445 |
| 2019-20 | 132,667 -614 | 104,615 -675 | 47,476 -375 | 57,139 -300 | 28,052 61 | 11,116 -168 | 16,936 229 |
| 2020-21 | 128,032 -4,635 | 99,499 -5,116 | 44,454 -3,022 | 55,045 -2,094 | 28,533 481 | 11,299 183 | 17,234 298 |
| 2021-22 | 127,748 -284 | 99,302 -197 | 44,034 -420 | 55,268 223 | 28,446 -87 | 10,913 -386 | 17,533 299 |
| 2022-23 | 127,650 -98 | 100,514 1,212 | 44,426 392 | 56,088 820 | 27,136 -1,310 | 10,341 -572 | 16,795 -738 |
| Average | 132,829 | 105,243 | 48,023 | 57,220 | 27,586 | 11,324 | 16,263 |