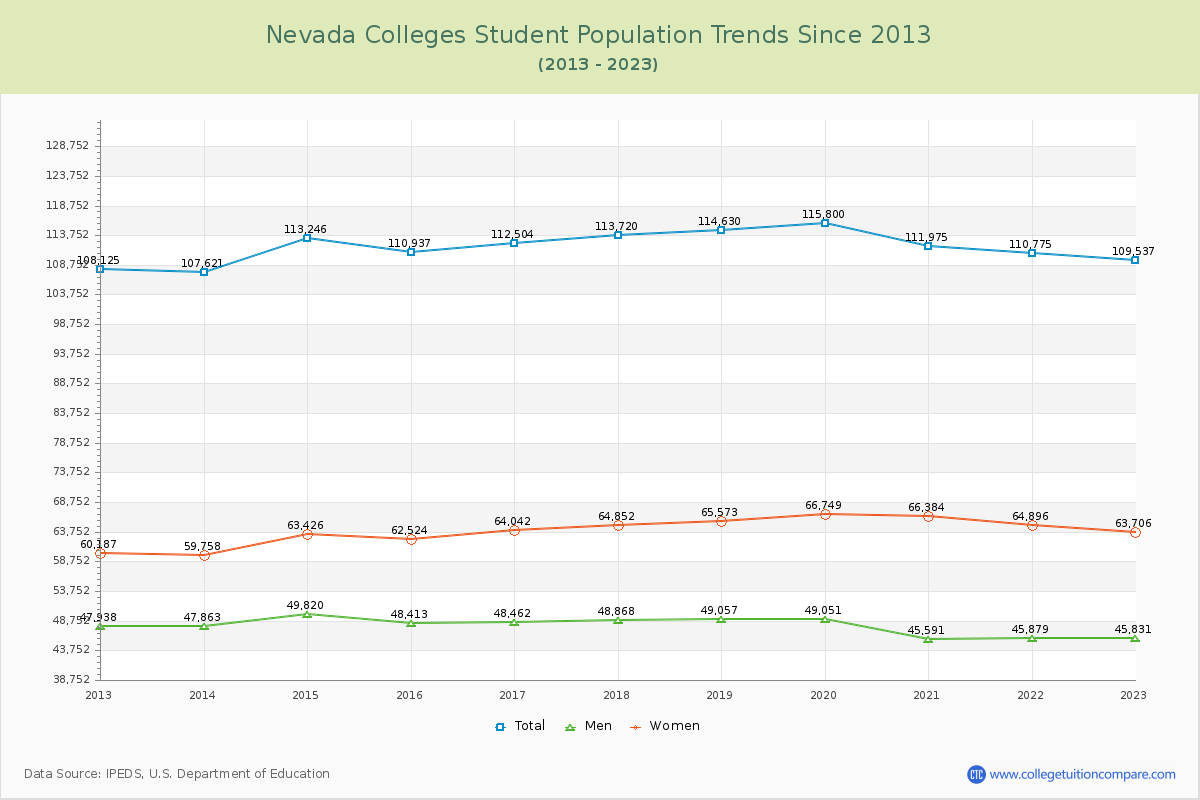
Student Population Changes
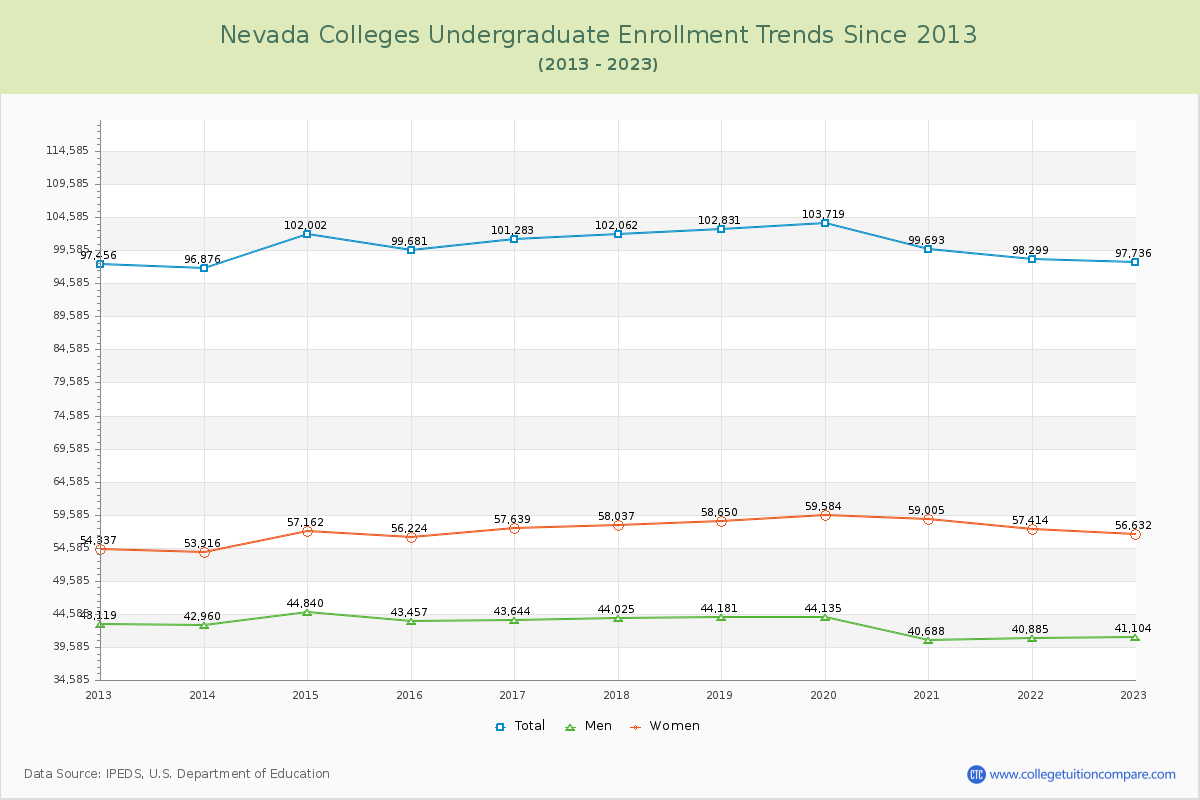
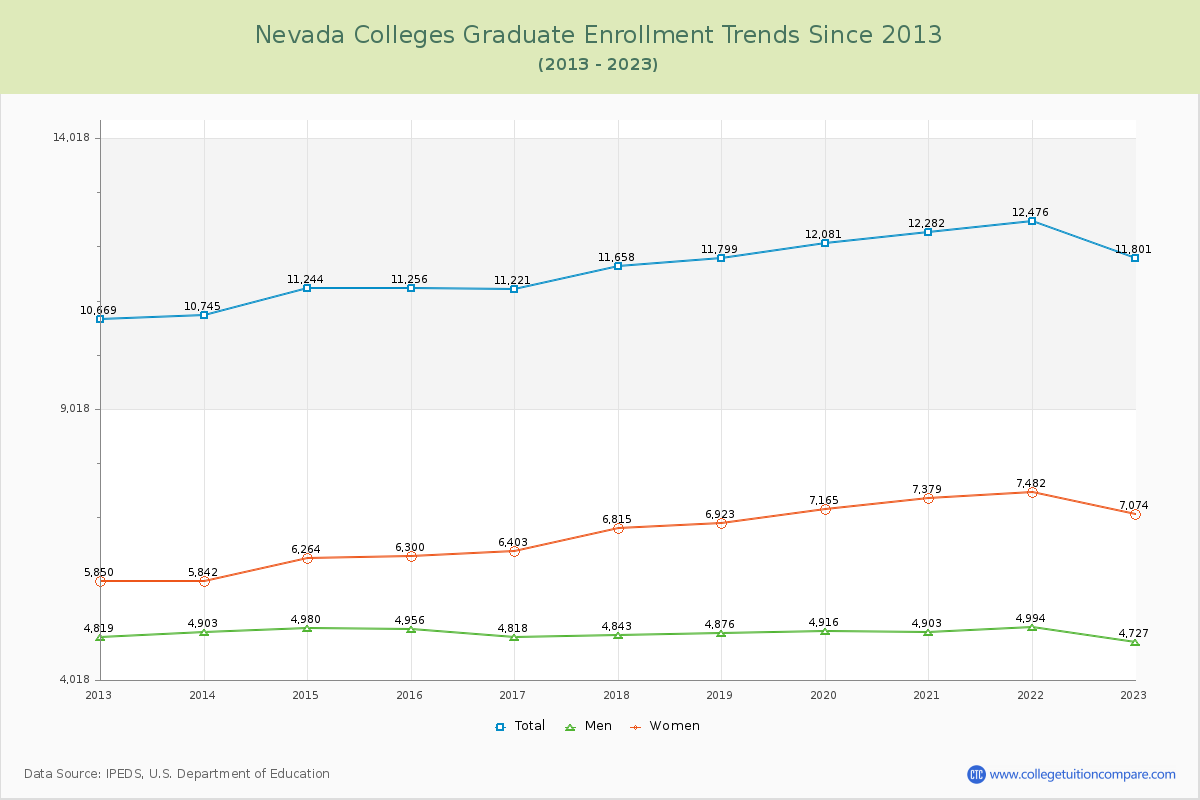
The average number of students over the past 11 years is 111,715, and 109,537 students were attending the schools in the academic year 2022-2023. Of the total students, 89.23% are undergraduate students and 10.77% are graduate students. Over the past 11, the number of undergraduate students increased by 280, and the graduate student enrollment increased by 1,132.
The female to male ratio is 1.39 to 1, meaning that there are more female students enrolled in Nevada Colleges than male students.
The following table and chart illustrate the changes in student population by gender at Nevada Colleges since 2013.
| Year | Total | Undergraduate | Graduate | ||||
|---|---|---|---|---|---|---|---|
| Total | Men | Women | Total | Men | Women | ||
| 2012-13 | 108,125 | 97,456 | 43,119 | 54,337 | 10,669 | 4,819 | 5,850 |
| 2013-14 | 107,621 -504 | 96,876 -580 | 42,960 -159 | 53,916 -421 | 10,745 76 | 4,903 84 | 5,842 -8 |
| 2014-15 | 113,246 5,625 | 102,002 5,126 | 44,840 1,880 | 57,162 3,246 | 11,244 499 | 4,980 77 | 6,264 422 |
| 2015-16 | 110,937 -2,309 | 99,681 -2,321 | 43,457 -1,383 | 56,224 -938 | 11,256 12 | 4,956 -24 | 6,300 36 |
| 2016-17 | 112,504 1,567 | 101,283 1,602 | 43,644 187 | 57,639 1,415 | 11,221 -35 | 4,818 -138 | 6,403 103 |
| 2017-18 | 113,720 1,216 | 102,062 779 | 44,025 381 | 58,037 398 | 11,658 437 | 4,843 25 | 6,815 412 |
| 2018-19 | 114,630 910 | 102,831 769 | 44,181 156 | 58,650 613 | 11,799 141 | 4,876 33 | 6,923 108 |
| 2019-20 | 115,800 1,170 | 103,719 888 | 44,135 -46 | 59,584 934 | 12,081 282 | 4,916 40 | 7,165 242 |
| 2020-21 | 111,975 -3,825 | 99,693 -4,026 | 40,688 -3,447 | 59,005 -579 | 12,282 201 | 4,903 -13 | 7,379 214 |
| 2021-22 | 110,775 -1,200 | 98,299 -1,394 | 40,885 197 | 57,414 -1,591 | 12,476 194 | 4,994 91 | 7,482 103 |
| 2022-23 | 109,537 -1,238 | 97,736 -563 | 41,104 219 | 56,632 -782 | 11,801 -675 | 4,727 -267 | 7,074 -408 |
| Average | 111,715 | 100,149 | 43,003 | 57,145 | 11,567 | 4,885 | 6,682 |