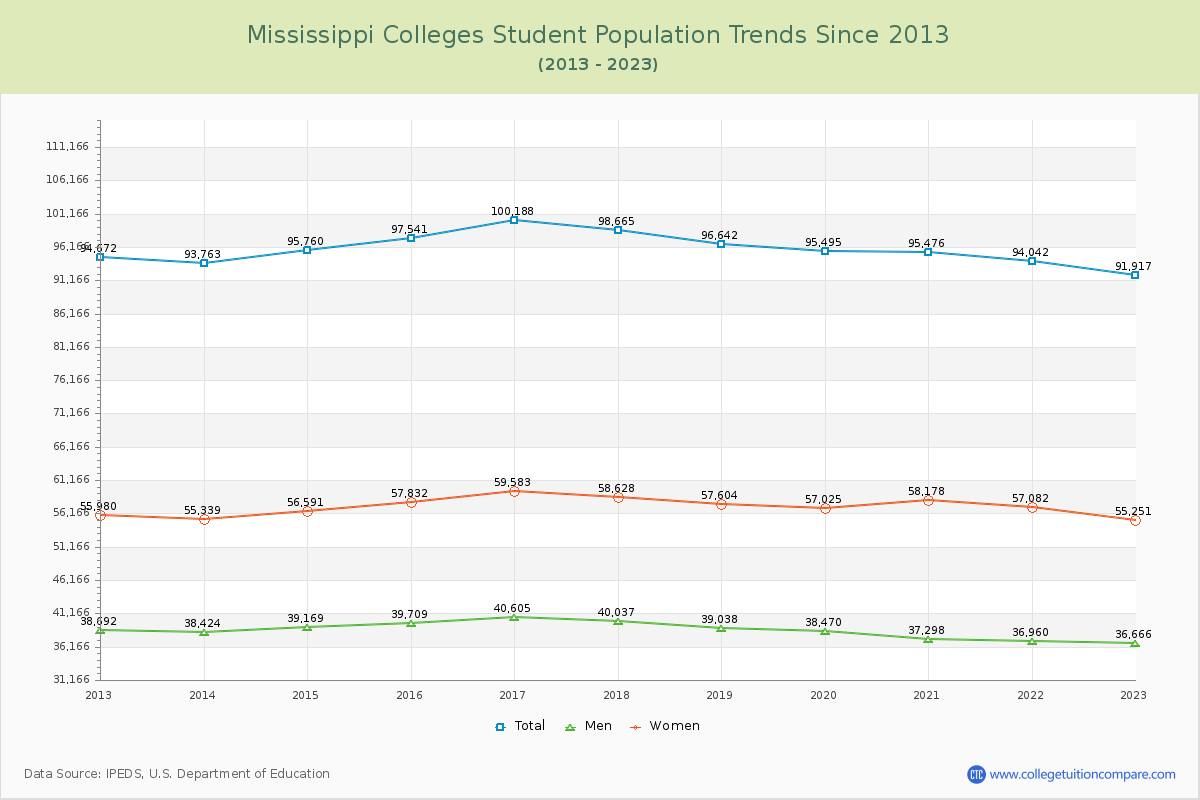
Student Population Changes
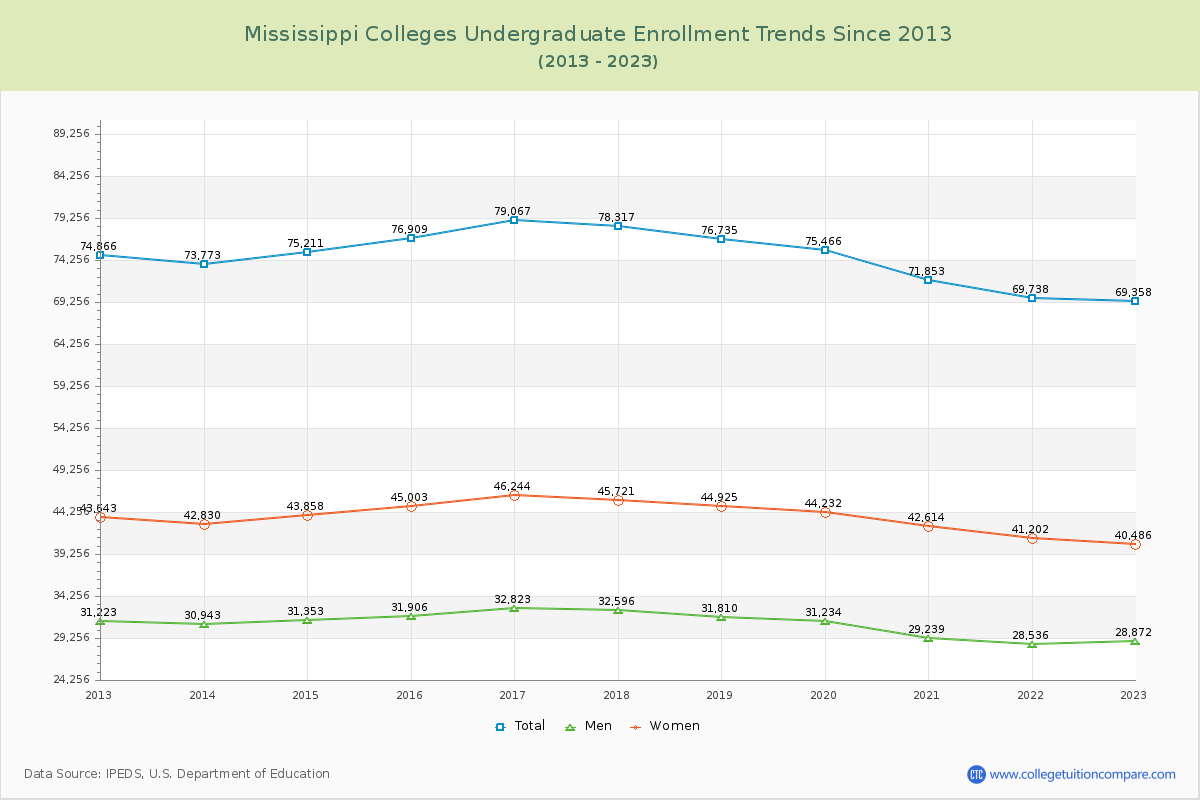
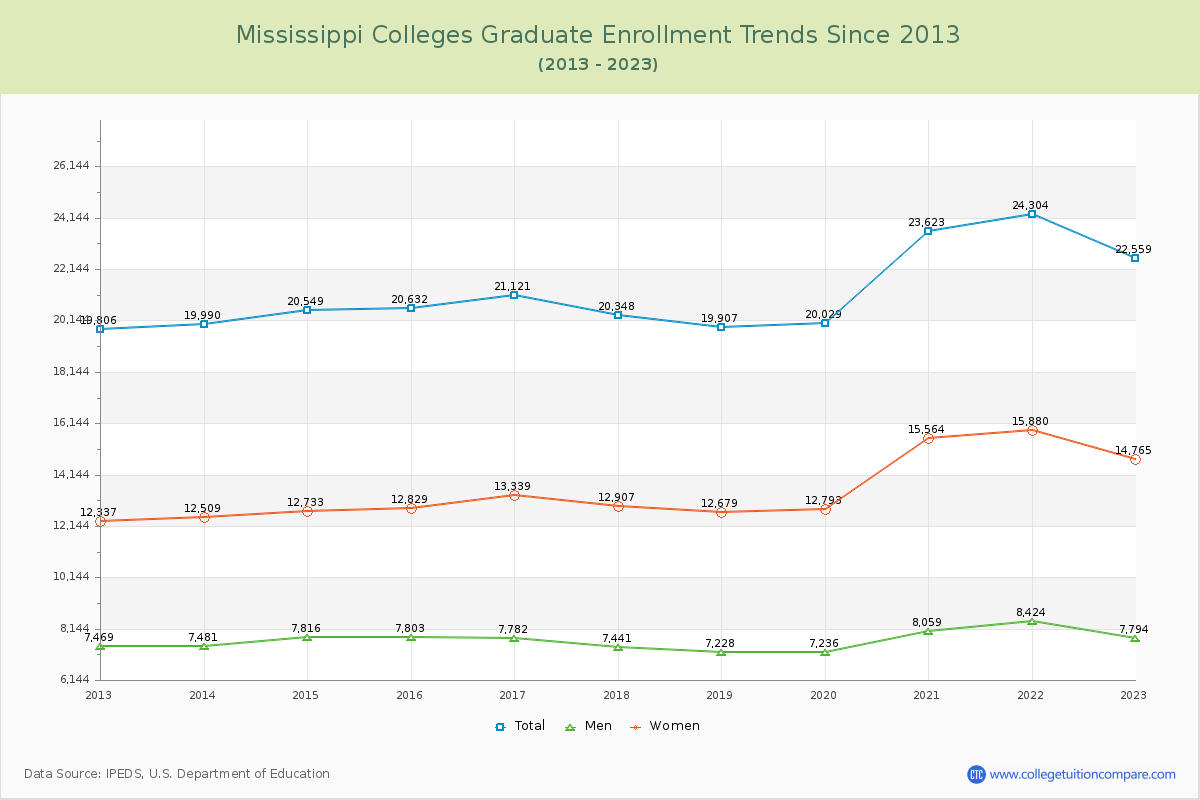
The average number of students over the past 11 years is 95,833, and 91,917 students were attending the schools in the academic year 2022-2023. Of the total students, 75.46% are undergraduate students and 24.54% are graduate students. Over the past 11, the number of undergraduate students decreased by 5,508, and the graduate student enrollment increased by 2,753.
The female to male ratio is 1.51 to 1, meaning that there are more female students enrolled in Mississippi Colleges than male students.
The following table and chart illustrate the changes in student population by gender at Mississippi Colleges since 2013.
| Year | Total | Undergraduate | Graduate | ||||
|---|---|---|---|---|---|---|---|
| Total | Men | Women | Total | Men | Women | ||
| 2012-13 | 94,672 | 74,866 | 31,223 | 43,643 | 19,806 | 7,469 | 12,337 |
| 2013-14 | 93,763 -909 | 73,773 -1,093 | 30,943 -280 | 42,830 -813 | 19,990 184 | 7,481 12 | 12,509 172 |
| 2014-15 | 95,760 1,997 | 75,211 1,438 | 31,353 410 | 43,858 1,028 | 20,549 559 | 7,816 335 | 12,733 224 |
| 2015-16 | 97,541 1,781 | 76,909 1,698 | 31,906 553 | 45,003 1,145 | 20,632 83 | 7,803 -13 | 12,829 96 |
| 2016-17 | 100,188 2,647 | 79,067 2,158 | 32,823 917 | 46,244 1,241 | 21,121 489 | 7,782 -21 | 13,339 510 |
| 2017-18 | 98,665 -1,523 | 78,317 -750 | 32,596 -227 | 45,721 -523 | 20,348 -773 | 7,441 -341 | 12,907 -432 |
| 2018-19 | 96,642 -2,023 | 76,735 -1,582 | 31,810 -786 | 44,925 -796 | 19,907 -441 | 7,228 -213 | 12,679 -228 |
| 2019-20 | 95,495 -1,147 | 75,466 -1,269 | 31,234 -576 | 44,232 -693 | 20,029 122 | 7,236 8 | 12,793 114 |
| 2020-21 | 95,476 -19 | 71,853 -3,613 | 29,239 -1,995 | 42,614 -1,618 | 23,623 3,594 | 8,059 823 | 15,564 2,771 |
| 2021-22 | 94,042 -1,434 | 69,738 -2,115 | 28,536 -703 | 41,202 -1,412 | 24,304 681 | 8,424 365 | 15,880 316 |
| 2022-23 | 91,917 -2,125 | 69,358 -380 | 28,872 336 | 40,486 -716 | 22,559 -1,745 | 7,794 -630 | 14,765 -1,115 |
| Average | 95,833 | 74,663 | 30,958 | 43,705 | 21,170 | 7,685 | 13,485 |