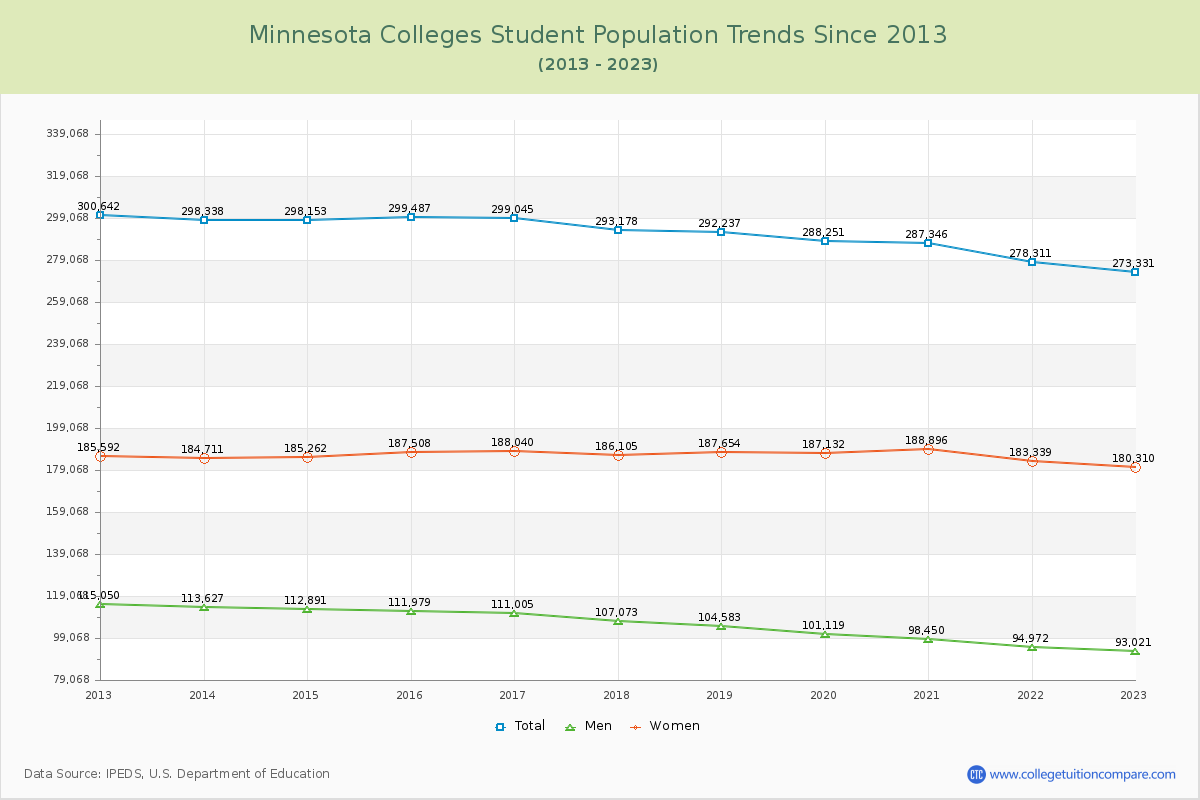
Student Population Changes
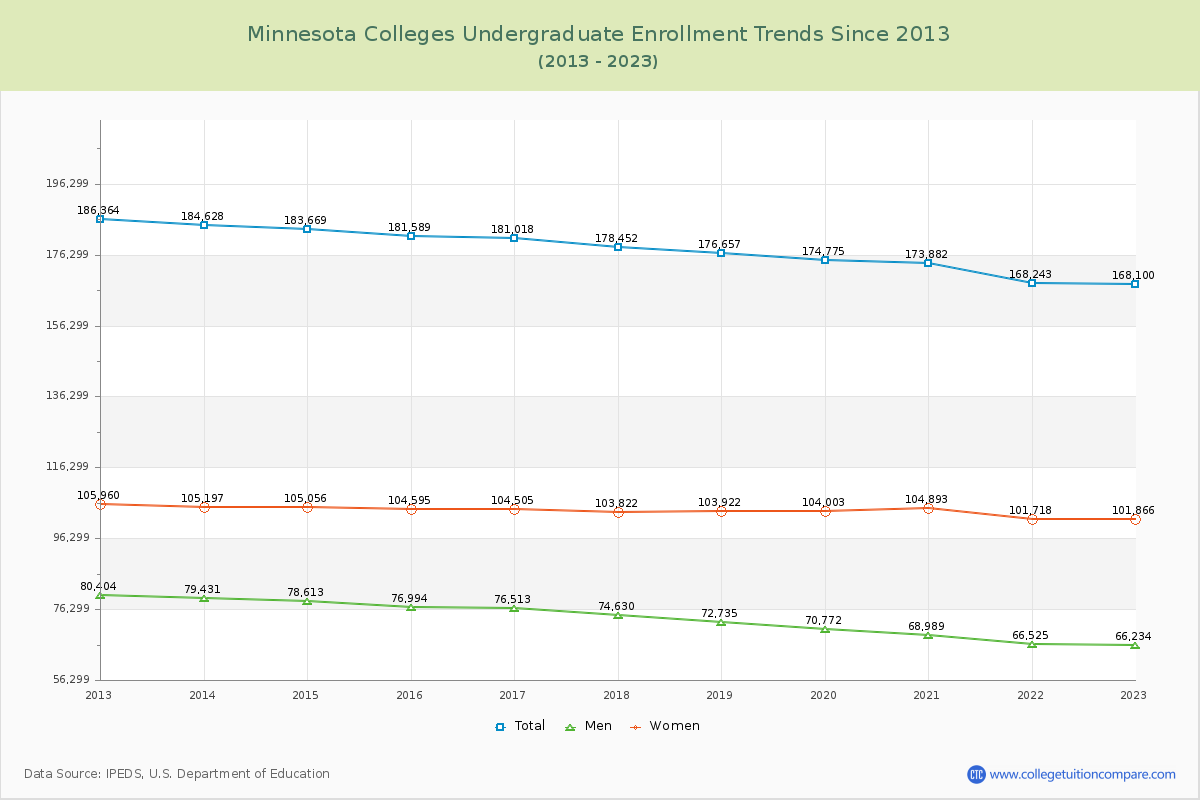
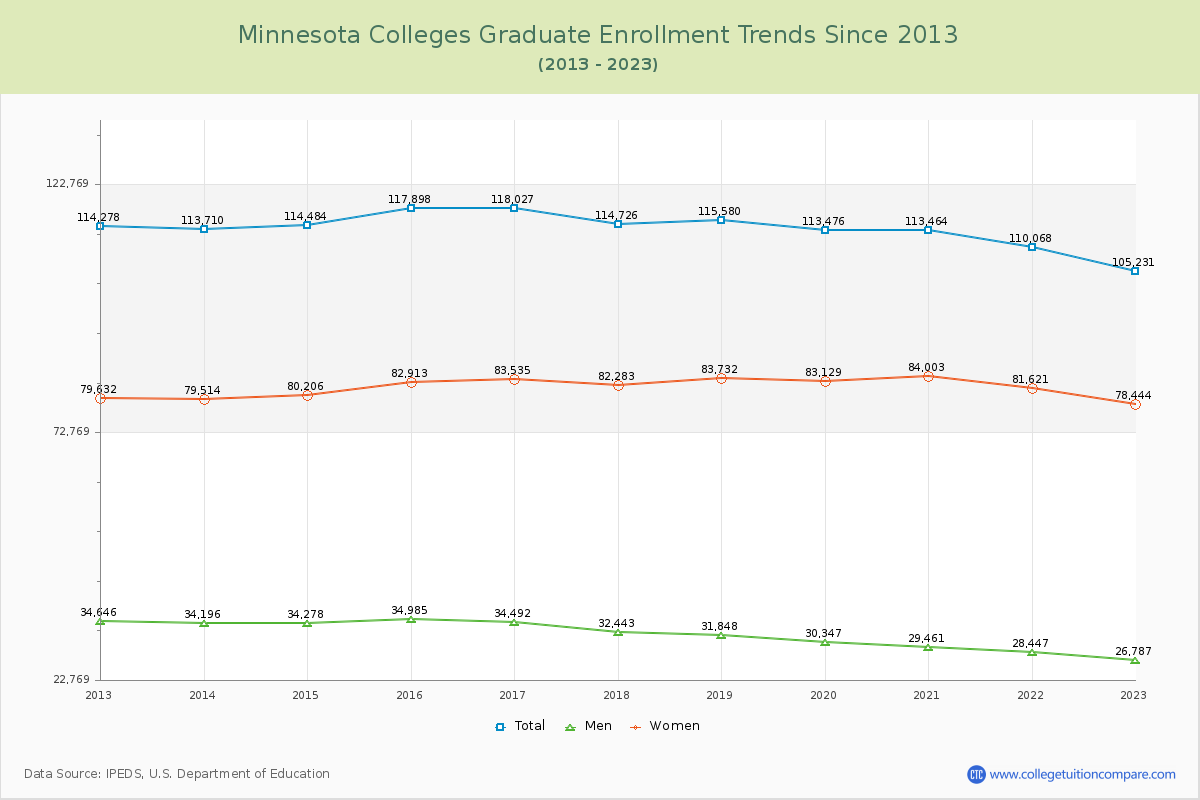
The average number of students over the past 11 years is 291,665, and 273,331 students were attending the schools in the academic year 2022-2023. Of the total students, 61.52% are undergraduate students and 38.48% are graduate students. Over the past 11, the number of undergraduate students decreased by 18,136, and the graduate student enrollment decreased by 9,047.
The female to male ratio is 1.94 to 1, meaning that there are more female students enrolled in Minnesota Colleges than male students.
The following table and chart illustrate the changes in student population by gender at Minnesota Colleges since 2013.
| Year | Total | Undergraduate | Graduate | ||||
|---|---|---|---|---|---|---|---|
| Total | Men | Women | Total | Men | Women | ||
| 2012-13 | 300,642 | 186,364 | 80,404 | 105,960 | 114,278 | 34,646 | 79,632 |
| 2013-14 | 298,338 -2,304 | 184,628 -1,736 | 79,431 -973 | 105,197 -763 | 113,710 -568 | 34,196 -450 | 79,514 -118 |
| 2014-15 | 298,153 -185 | 183,669 -959 | 78,613 -818 | 105,056 -141 | 114,484 774 | 34,278 82 | 80,206 692 |
| 2015-16 | 299,487 1,334 | 181,589 -2,080 | 76,994 -1,619 | 104,595 -461 | 117,898 3,414 | 34,985 707 | 82,913 2,707 |
| 2016-17 | 299,045 -442 | 181,018 -571 | 76,513 -481 | 104,505 -90 | 118,027 129 | 34,492 -493 | 83,535 622 |
| 2017-18 | 293,178 -5,867 | 178,452 -2,566 | 74,630 -1,883 | 103,822 -683 | 114,726 -3,301 | 32,443 -2,049 | 82,283 -1,252 |
| 2018-19 | 292,237 -941 | 176,657 -1,795 | 72,735 -1,895 | 103,922 100 | 115,580 854 | 31,848 -595 | 83,732 1,449 |
| 2019-20 | 288,251 -3,986 | 174,775 -1,882 | 70,772 -1,963 | 104,003 81 | 113,476 -2,104 | 30,347 -1,501 | 83,129 -603 |
| 2020-21 | 287,346 -905 | 173,882 -893 | 68,989 -1,783 | 104,893 890 | 113,464 -12 | 29,461 -886 | 84,003 874 |
| 2021-22 | 278,311 -9,035 | 168,243 -5,639 | 66,525 -2,464 | 101,718 -3,175 | 110,068 -3,396 | 28,447 -1,014 | 81,621 -2,382 |
| 2022-23 | 273,331 -4,980 | 168,100 -143 | 66,234 -291 | 101,866 148 | 105,231 -4,837 | 26,787 -1,660 | 78,444 -3,177 |
| Average | 291,665 | 177,943 | 73,804 | 104,140 | 113,722 | 31,994 | 81,728 |