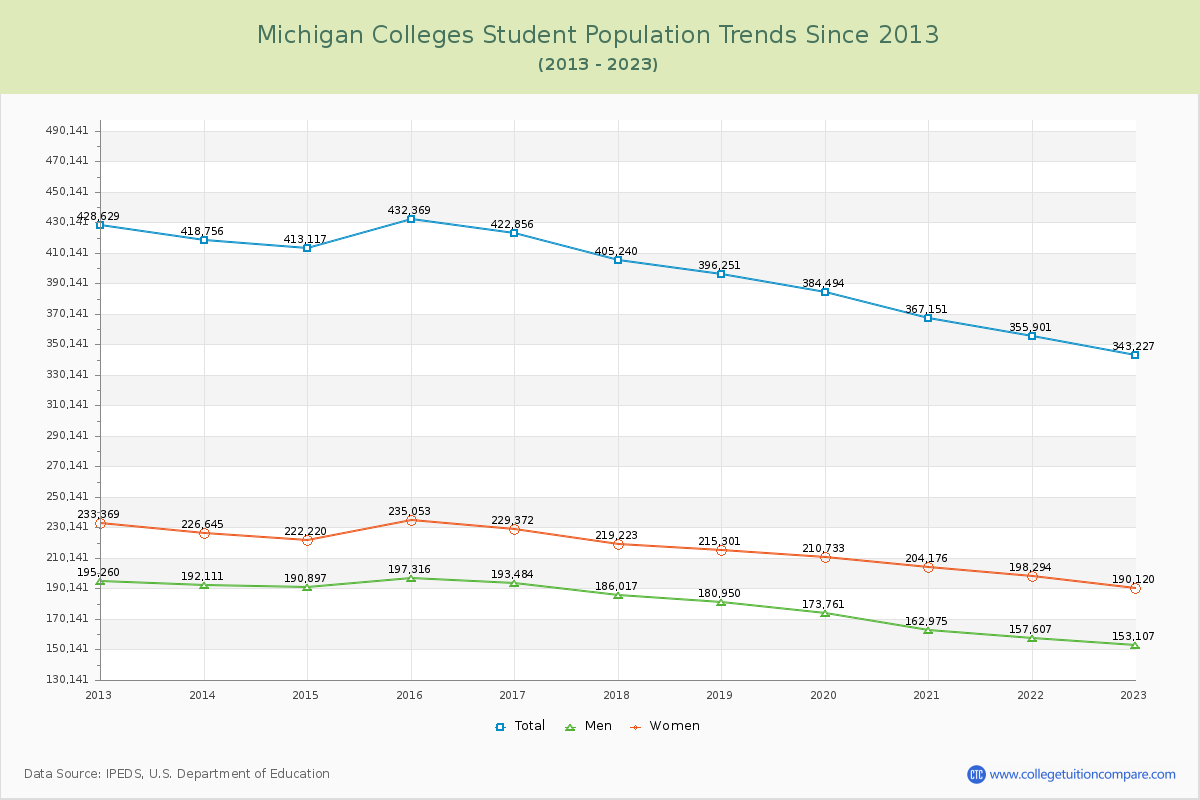
Student Population Changes
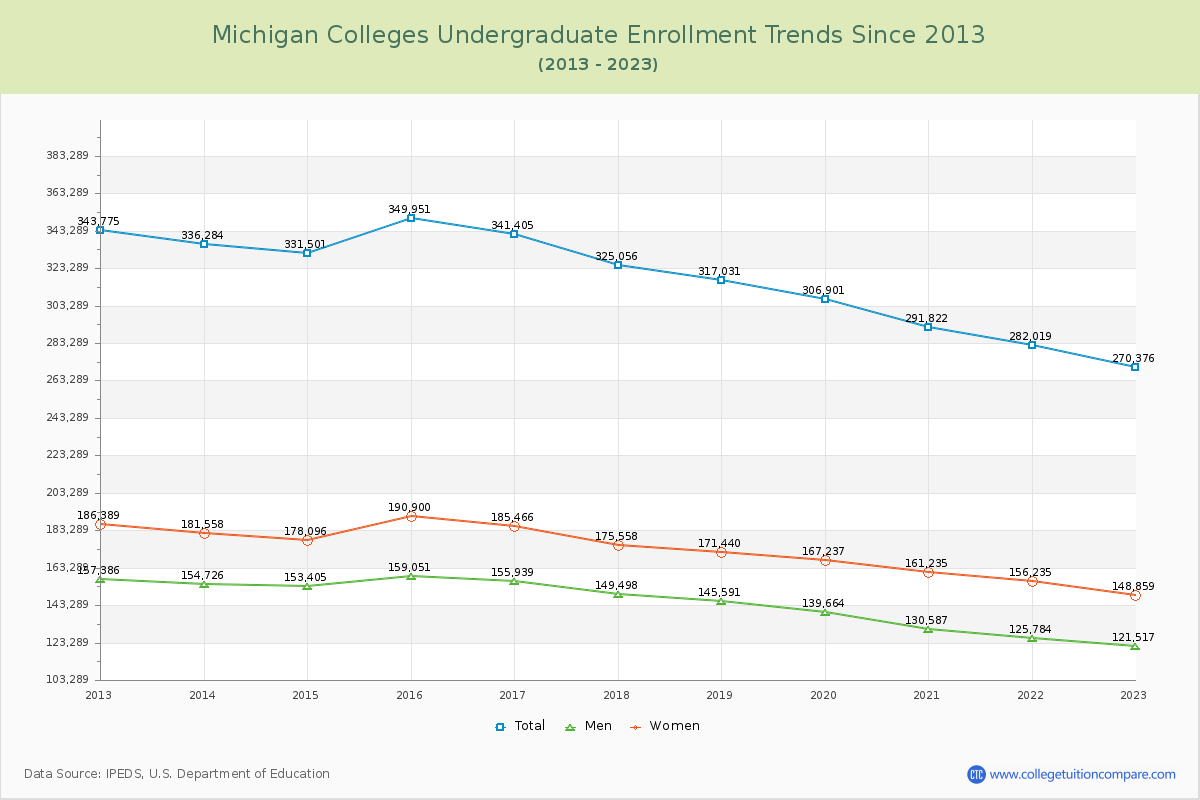
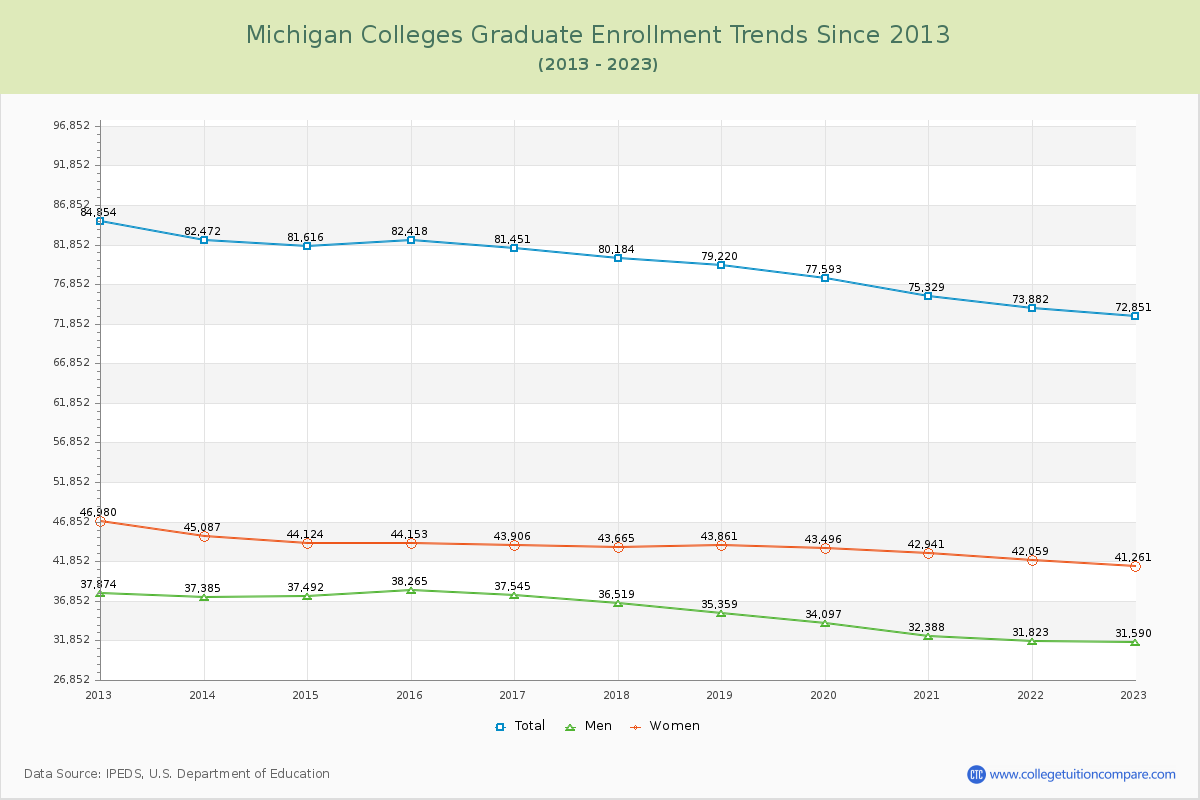
The average number of students over the past 11 years is 397,090, and 343,227 students were attending the schools in the academic year 2022-2023. Of the total students, 78.77% are undergraduate students and 21.23% are graduate students. Over the past 11, the number of undergraduate students decreased by 73,399, and the graduate student enrollment decreased by 12,003.
The female to male ratio is 1.24 to 1, meaning that there are slightly more female students enrolled in Michigan Colleges than male students.
The following table and chart illustrate the changes in student population by gender at Michigan Colleges since 2013.
| Year | Total | Undergraduate | Graduate | ||||
|---|---|---|---|---|---|---|---|
| Total | Men | Women | Total | Men | Women | ||
| 2012-13 | 428,629 | 343,775 | 157,386 | 186,389 | 84,854 | 37,874 | 46,980 |
| 2013-14 | 418,756 -9,873 | 336,284 -7,491 | 154,726 -2,660 | 181,558 -4,831 | 82,472 -2,382 | 37,385 -489 | 45,087 -1,893 |
| 2014-15 | 413,117 -5,639 | 331,501 -4,783 | 153,405 -1,321 | 178,096 -3,462 | 81,616 -856 | 37,492 107 | 44,124 -963 |
| 2015-16 | 432,369 19,252 | 349,951 18,450 | 159,051 5,646 | 190,900 12,804 | 82,418 802 | 38,265 773 | 44,153 29 |
| 2016-17 | 422,856 -9,513 | 341,405 -8,546 | 155,939 -3,112 | 185,466 -5,434 | 81,451 -967 | 37,545 -720 | 43,906 -247 |
| 2017-18 | 405,240 -17,616 | 325,056 -16,349 | 149,498 -6,441 | 175,558 -9,908 | 80,184 -1,267 | 36,519 -1,026 | 43,665 -241 |
| 2018-19 | 396,251 -8,989 | 317,031 -8,025 | 145,591 -3,907 | 171,440 -4,118 | 79,220 -964 | 35,359 -1,160 | 43,861 196 |
| 2019-20 | 384,494 -11,757 | 306,901 -10,130 | 139,664 -5,927 | 167,237 -4,203 | 77,593 -1,627 | 34,097 -1,262 | 43,496 -365 |
| 2020-21 | 367,151 -17,343 | 291,822 -15,079 | 130,587 -9,077 | 161,235 -6,002 | 75,329 -2,264 | 32,388 -1,709 | 42,941 -555 |
| 2021-22 | 355,901 -11,250 | 282,019 -9,803 | 125,784 -4,803 | 156,235 -5,000 | 73,882 -1,447 | 31,823 -565 | 42,059 -882 |
| 2022-23 | 343,227 -12,674 | 270,376 -11,643 | 121,517 -4,267 | 148,859 -7,376 | 72,851 -1,031 | 31,590 -233 | 41,261 -798 |
| Average | 397,090 | 317,829 | 144,832 | 172,998 | 79,261 | 35,485 | 43,776 |