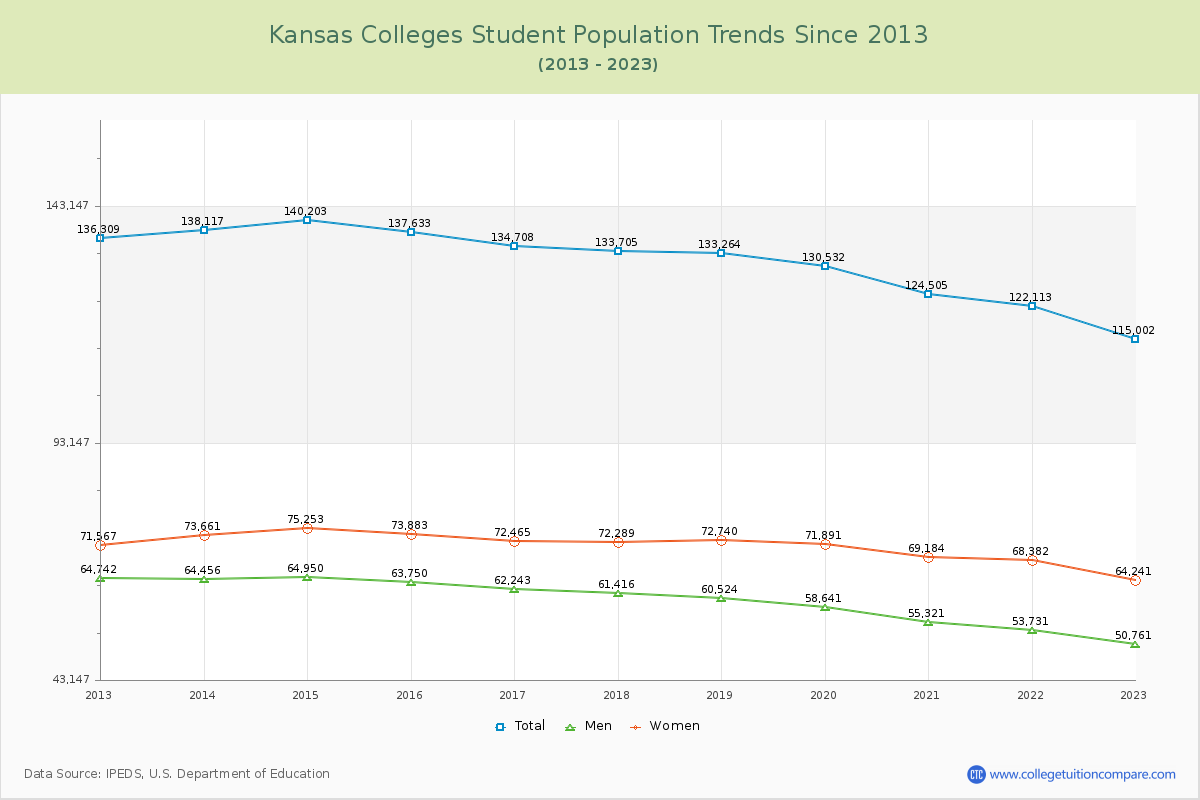
Student Population Changes
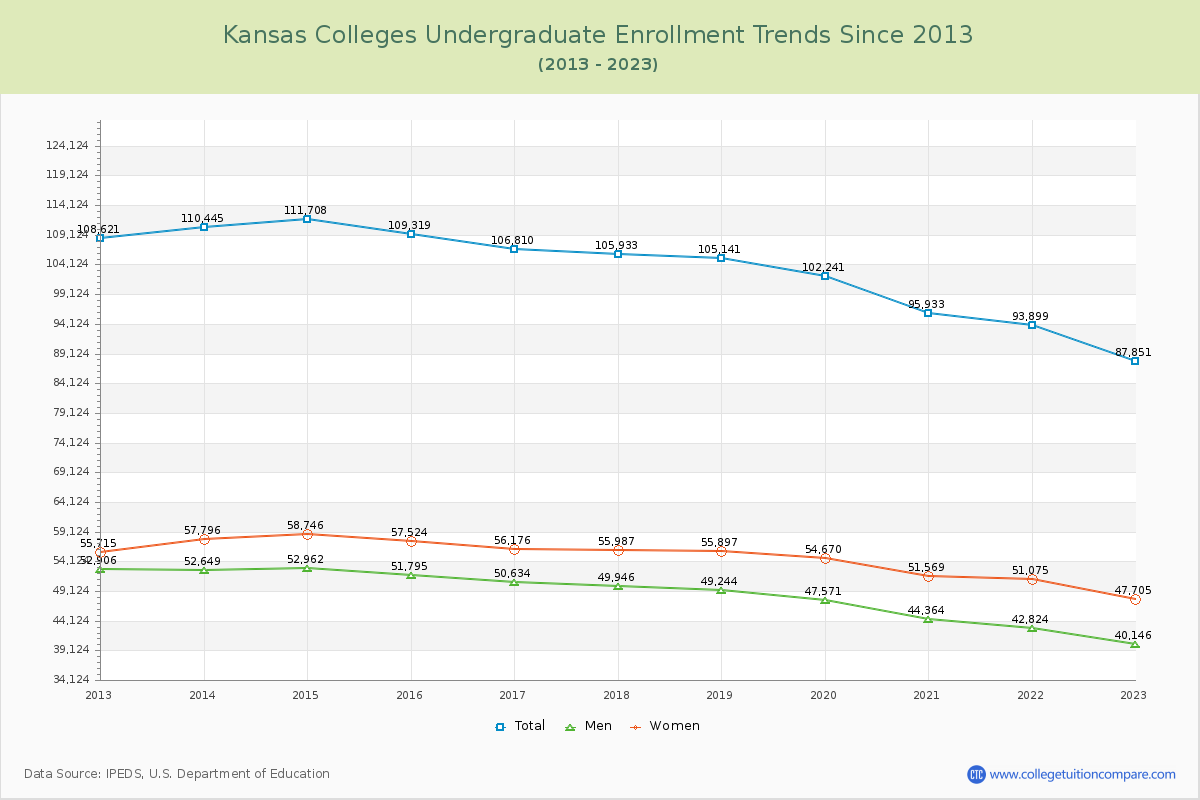
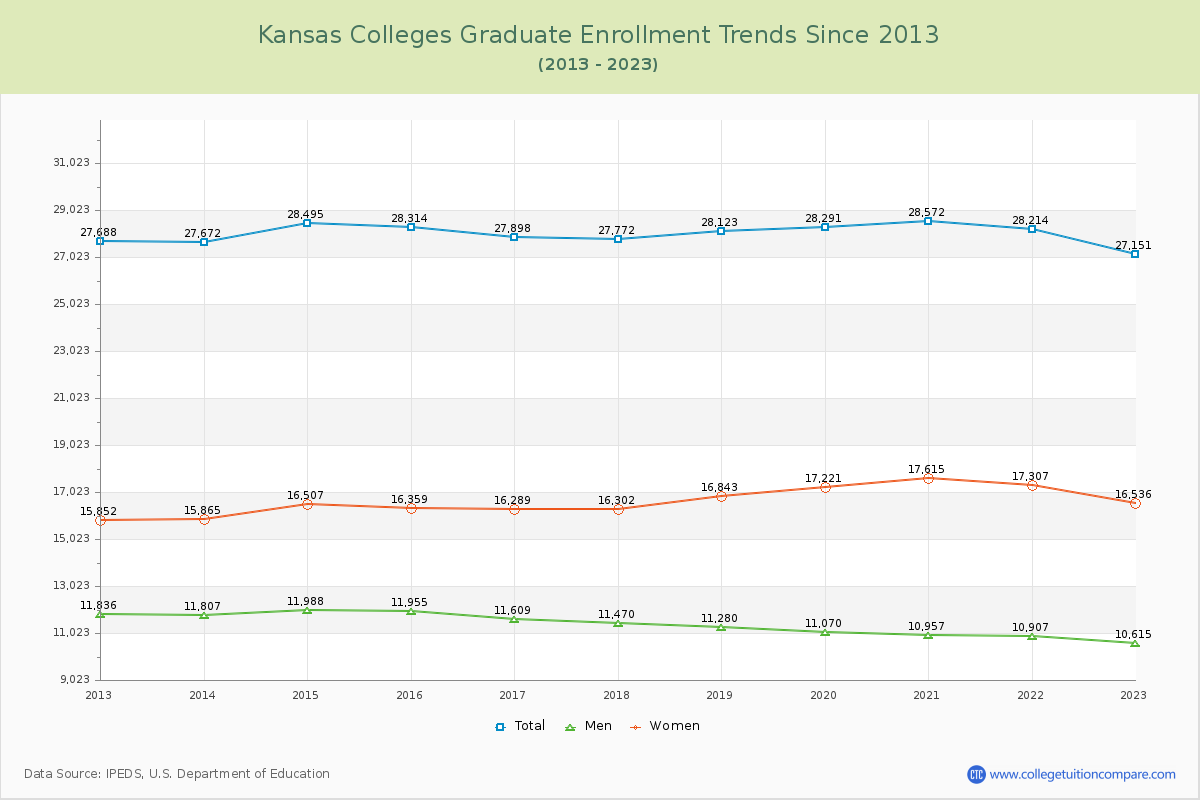
The average number of students over the past 11 years is 131,463, and 115,002 students were attending the schools in the academic year 2022-2023. Of the total students, 76.39% are undergraduate students and 23.61% are graduate students. Over the past 11, the number of undergraduate students decreased by 20,770, and the graduate student enrollment decreased by 537.
The female to male ratio is 1.27 to 1, meaning that there are slightly more female students enrolled in Kansas Colleges than male students.
The following table and chart illustrate the changes in student population by gender at Kansas Colleges since 2013.
| Year | Total | Undergraduate | Graduate | ||||
|---|---|---|---|---|---|---|---|
| Total | Men | Women | Total | Men | Women | ||
| 2012-13 | 136,309 | 108,621 | 52,906 | 55,715 | 27,688 | 11,836 | 15,852 |
| 2013-14 | 138,117 1,808 | 110,445 1,824 | 52,649 -257 | 57,796 2,081 | 27,672 -16 | 11,807 -29 | 15,865 13 |
| 2014-15 | 140,203 2,086 | 111,708 1,263 | 52,962 313 | 58,746 950 | 28,495 823 | 11,988 181 | 16,507 642 |
| 2015-16 | 137,633 -2,570 | 109,319 -2,389 | 51,795 -1,167 | 57,524 -1,222 | 28,314 -181 | 11,955 -33 | 16,359 -148 |
| 2016-17 | 134,708 -2,925 | 106,810 -2,509 | 50,634 -1,161 | 56,176 -1,348 | 27,898 -416 | 11,609 -346 | 16,289 -70 |
| 2017-18 | 133,705 -1,003 | 105,933 -877 | 49,946 -688 | 55,987 -189 | 27,772 -126 | 11,470 -139 | 16,302 13 |
| 2018-19 | 133,264 -441 | 105,141 -792 | 49,244 -702 | 55,897 -90 | 28,123 351 | 11,280 -190 | 16,843 541 |
| 2019-20 | 130,532 -2,732 | 102,241 -2,900 | 47,571 -1,673 | 54,670 -1,227 | 28,291 168 | 11,070 -210 | 17,221 378 |
| 2020-21 | 124,505 -6,027 | 95,933 -6,308 | 44,364 -3,207 | 51,569 -3,101 | 28,572 281 | 10,957 -113 | 17,615 394 |
| 2021-22 | 122,113 -2,392 | 93,899 -2,034 | 42,824 -1,540 | 51,075 -494 | 28,214 -358 | 10,907 -50 | 17,307 -308 |
| 2022-23 | 115,002 -7,111 | 87,851 -6,048 | 40,146 -2,678 | 47,705 -3,370 | 27,151 -1,063 | 10,615 -292 | 16,536 -771 |
| Average | 131,463 | 103,446 | 48,640 | 54,805 | 28,017 | 11,409 | 16,609 |