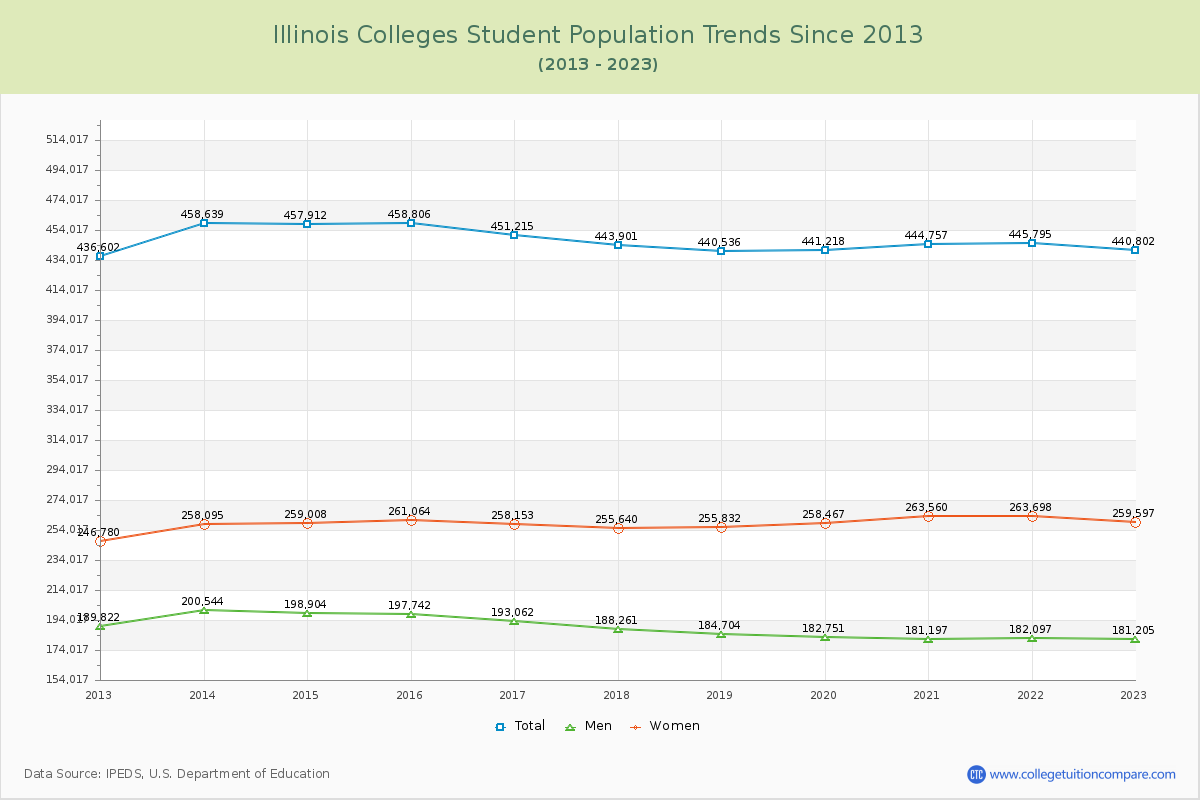
Student Population Changes
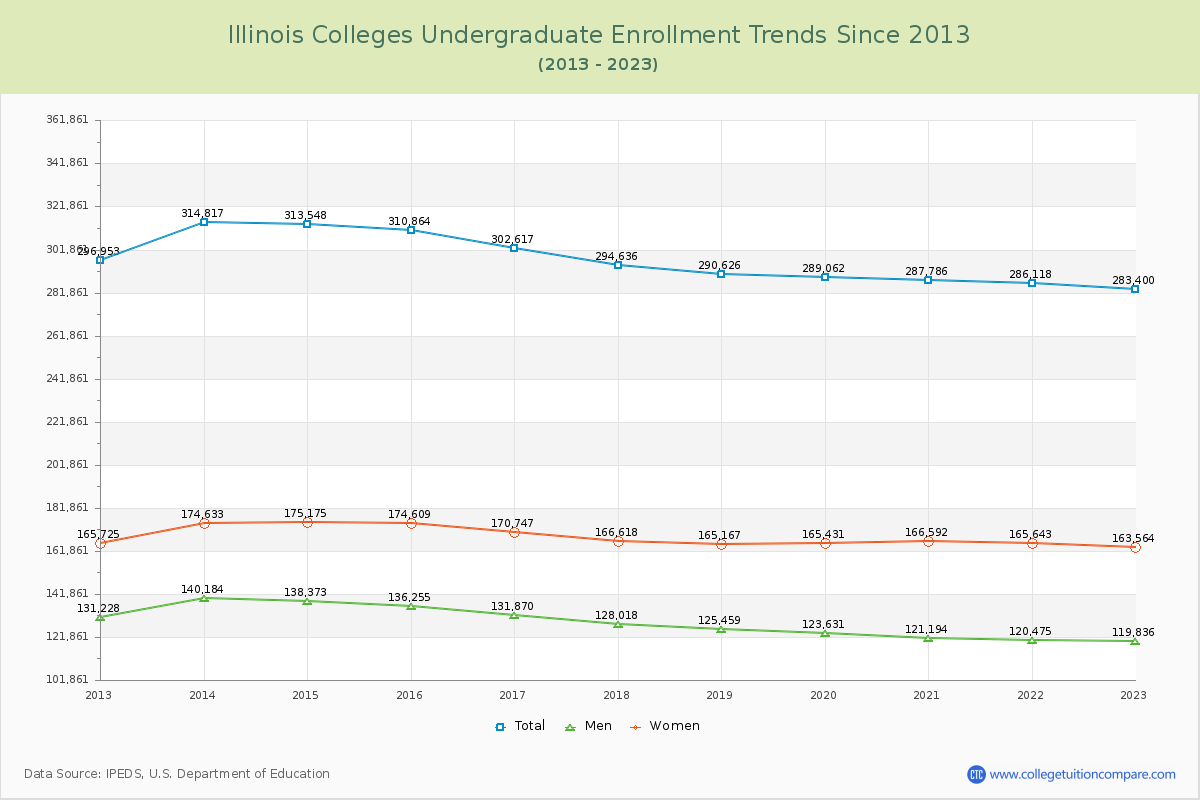
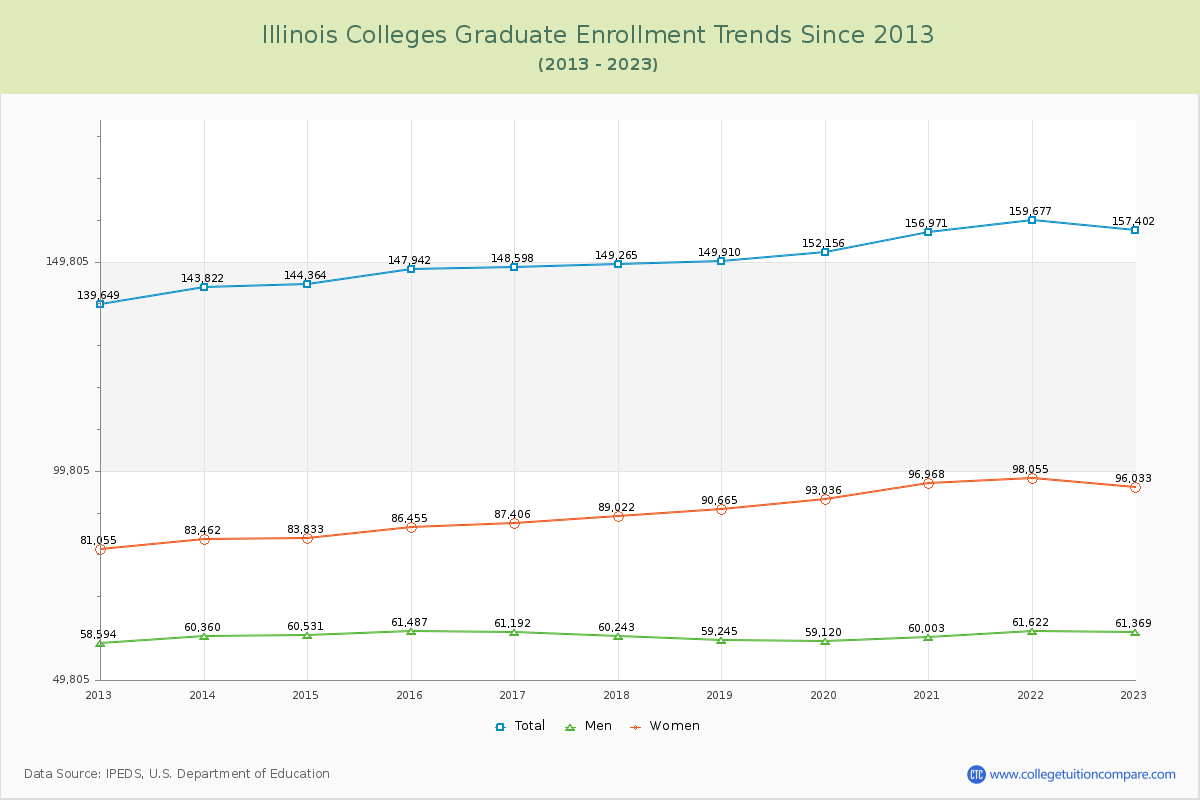
The average number of students over the past 11 years is 447,289, and 440,802 students were attending the schools in the academic year 2022-2023. Of the total students, 64.29% are undergraduate students and 35.71% are graduate students. Over the past 11, the number of undergraduate students decreased by 13,553, and the graduate student enrollment increased by 17,753.
The female to male ratio is 1.43 to 1, meaning that there are more female students enrolled in Illinois Colleges than male students.
The following table and chart illustrate the changes in student population by gender at Illinois Colleges since 2013.
| Year | Total | Undergraduate | Graduate | ||||
|---|---|---|---|---|---|---|---|
| Total | Men | Women | Total | Men | Women | ||
| 2012-13 | 436,602 | 296,953 | 131,228 | 165,725 | 139,649 | 58,594 | 81,055 |
| 2013-14 | 458,639 22,037 | 314,817 17,864 | 140,184 8,956 | 174,633 8,908 | 143,822 4,173 | 60,360 1,766 | 83,462 2,407 |
| 2014-15 | 457,912 -727 | 313,548 -1,269 | 138,373 -1,811 | 175,175 542 | 144,364 542 | 60,531 171 | 83,833 371 |
| 2015-16 | 458,806 894 | 310,864 -2,684 | 136,255 -2,118 | 174,609 -566 | 147,942 3,578 | 61,487 956 | 86,455 2,622 |
| 2016-17 | 451,215 -7,591 | 302,617 -8,247 | 131,870 -4,385 | 170,747 -3,862 | 148,598 656 | 61,192 -295 | 87,406 951 |
| 2017-18 | 443,901 -7,314 | 294,636 -7,981 | 128,018 -3,852 | 166,618 -4,129 | 149,265 667 | 60,243 -949 | 89,022 1,616 |
| 2018-19 | 440,536 -3,365 | 290,626 -4,010 | 125,459 -2,559 | 165,167 -1,451 | 149,910 645 | 59,245 -998 | 90,665 1,643 |
| 2019-20 | 441,218 682 | 289,062 -1,564 | 123,631 -1,828 | 165,431 264 | 152,156 2,246 | 59,120 -125 | 93,036 2,371 |
| 2020-21 | 444,757 3,539 | 287,786 -1,276 | 121,194 -2,437 | 166,592 1,161 | 156,971 4,815 | 60,003 883 | 96,968 3,932 |
| 2021-22 | 445,795 1,038 | 286,118 -1,668 | 120,475 -719 | 165,643 -949 | 159,677 2,706 | 61,622 1,619 | 98,055 1,087 |
| 2022-23 | 440,802 -4,993 | 283,400 -2,718 | 119,836 -639 | 163,564 -2,079 | 157,402 -2,275 | 61,369 -253 | 96,033 -2,022 |
| Average | 447,289 | 297,312 | 128,775 | 168,537 | 149,978 | 60,342 | 89,635 |