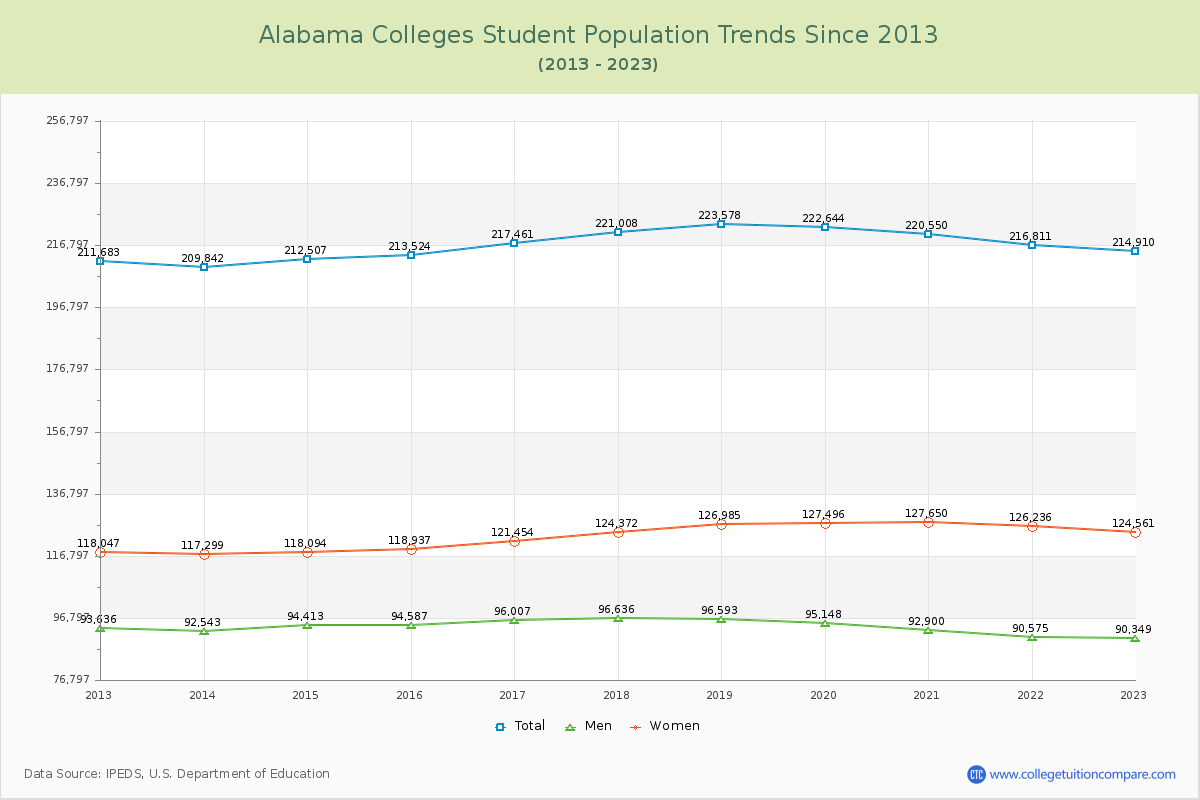
Student Population Changes
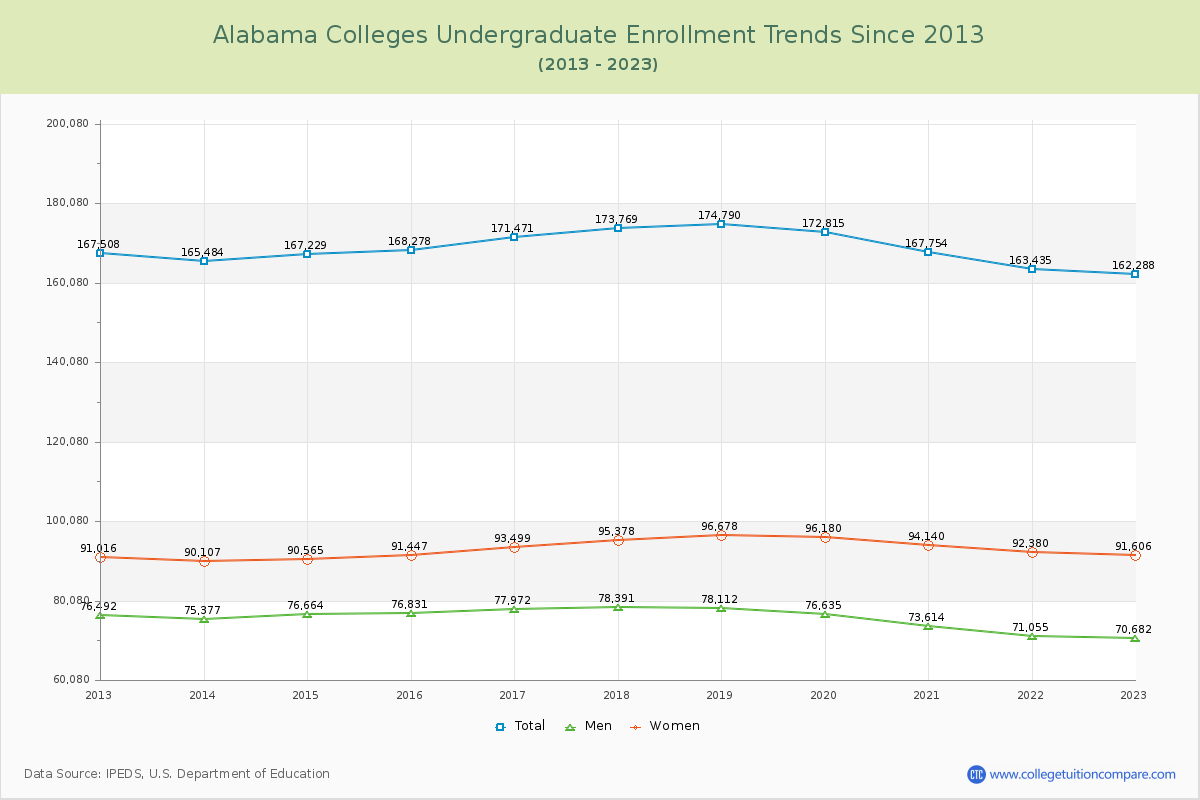
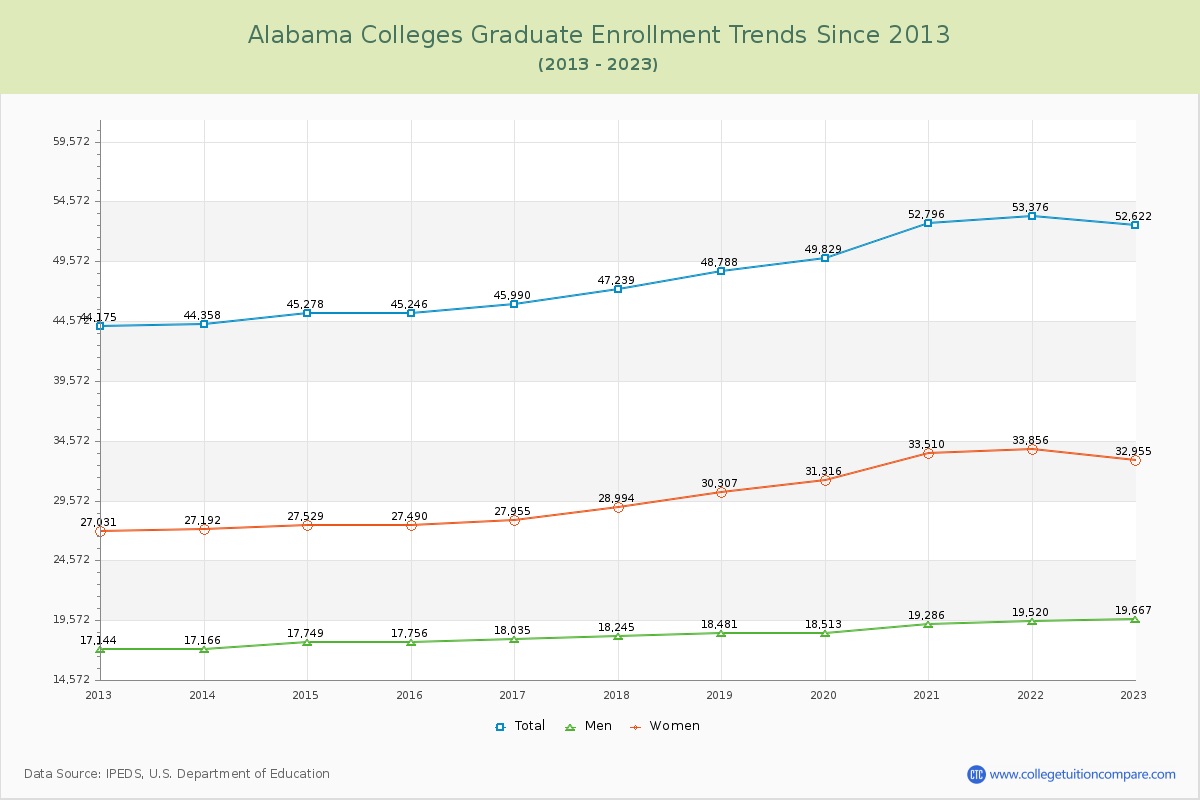
The average number of students over the past 11 years is 216,774, and 214,910 students were attending the schools in the academic year 2022-2023. Of the total students, 75.51% are undergraduate students and 24.49% are graduate students. Over the past 11, the number of undergraduate students decreased by 5,220, and the graduate student enrollment increased by 8,447.
The female to male ratio is 1.38 to 1, meaning that there are more female students enrolled in Alabama Colleges than male students.
The following table and chart illustrate the changes in student population by gender at Alabama Colleges since 2013.
| Year | Total | Undergraduate | Graduate | ||||
|---|---|---|---|---|---|---|---|
| Total | Men | Women | Total | Men | Women | ||
| 2012-13 | 211,683 | 167,508 | 76,492 | 91,016 | 44,175 | 17,144 | 27,031 |
| 2013-14 | 209,842 -1,841 | 165,484 -2,024 | 75,377 -1,115 | 90,107 -909 | 44,358 183 | 17,166 22 | 27,192 161 |
| 2014-15 | 212,507 2,665 | 167,229 1,745 | 76,664 1,287 | 90,565 458 | 45,278 920 | 17,749 583 | 27,529 337 |
| 2015-16 | 213,524 1,017 | 168,278 1,049 | 76,831 167 | 91,447 882 | 45,246 -32 | 17,756 7 | 27,490 -39 |
| 2016-17 | 217,461 3,937 | 171,471 3,193 | 77,972 1,141 | 93,499 2,052 | 45,990 744 | 18,035 279 | 27,955 465 |
| 2017-18 | 221,008 3,547 | 173,769 2,298 | 78,391 419 | 95,378 1,879 | 47,239 1,249 | 18,245 210 | 28,994 1,039 |
| 2018-19 | 223,578 2,570 | 174,790 1,021 | 78,112 -279 | 96,678 1,300 | 48,788 1,549 | 18,481 236 | 30,307 1,313 |
| 2019-20 | 222,644 -934 | 172,815 -1,975 | 76,635 -1,477 | 96,180 -498 | 49,829 1,041 | 18,513 32 | 31,316 1,009 |
| 2020-21 | 220,550 -2,094 | 167,754 -5,061 | 73,614 -3,021 | 94,140 -2,040 | 52,796 2,967 | 19,286 773 | 33,510 2,194 |
| 2021-22 | 216,811 -3,739 | 163,435 -4,319 | 71,055 -2,559 | 92,380 -1,760 | 53,376 580 | 19,520 234 | 33,856 346 |
| 2022-23 | 214,910 -1,901 | 162,288 -1,147 | 70,682 -373 | 91,606 -774 | 52,622 -754 | 19,667 147 | 32,955 -901 |
| Average | 216,774 | 168,620 | 75,620 | 93,000 | 48,154 | 18,324 | 29,830 |