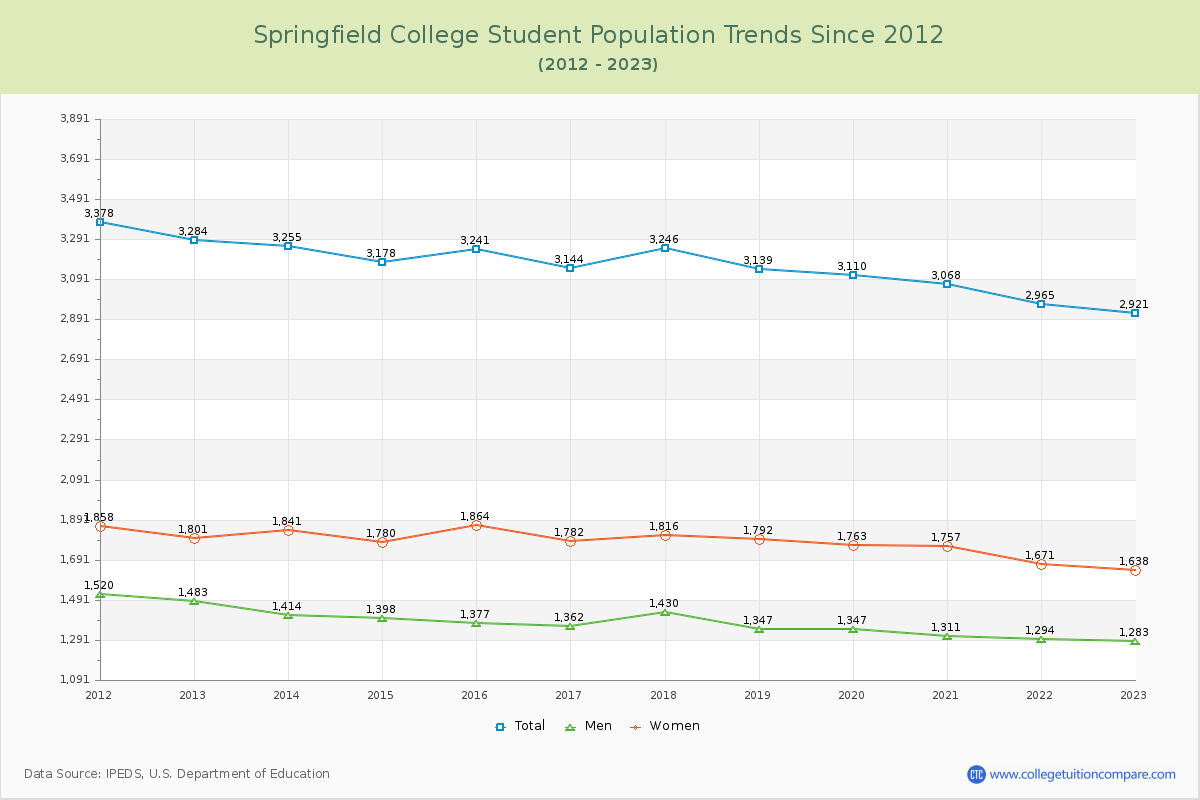
Student Population Changes
The average student population over the last 12 years is 3,141 where 2,921 students are attending the school for the academic year 2022-2023.
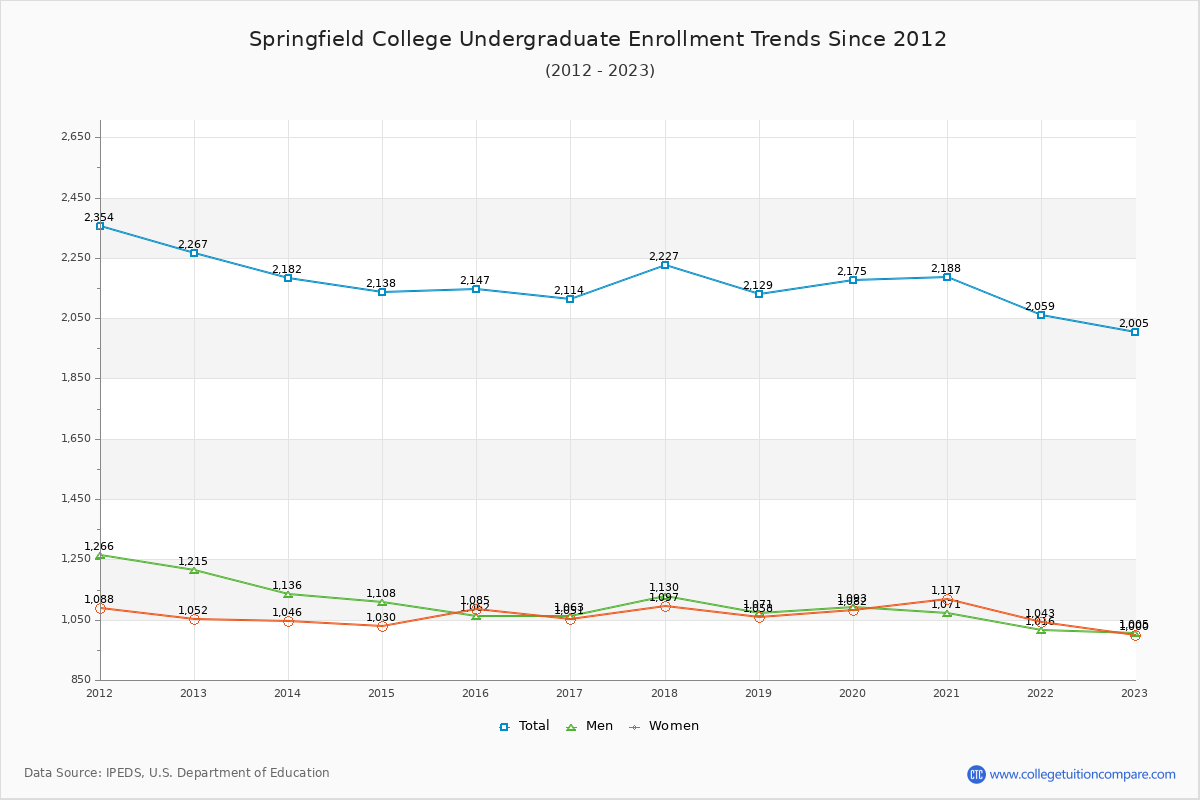
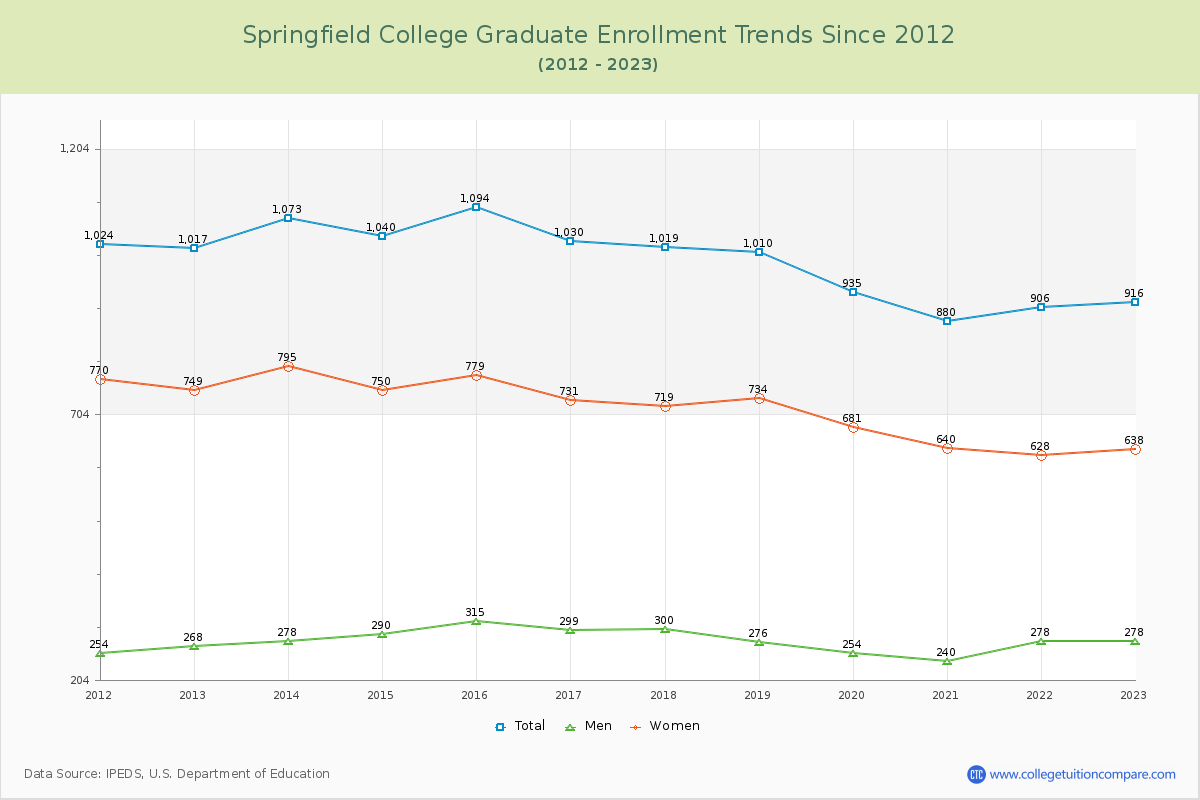
68.64% of total students is undergraduate students and 31.36% students is graduate students. The number of undergraduate students has decreased by 262 and the graduate enrollment has decreased by 101 over past 10 years.
The female to male ratio is 1.28 to 1 and it means that there are slightly more female students enrolled in Springfield than male students.
The following table and chart illustrate the changes in student population by gender at Springfield College since 2012.
| Year | Total | Undergraduate | Graduate | ||||
|---|---|---|---|---|---|---|---|
| Total | Men | Women | Total | Men | Women | ||
| 2012-13 | 3,284 | 2,267 | 1,215 | 1,052 | 1,017 | 268 | 749 |
| 2013-14 | 3,255 -29 | 2,182 -85 | 1,136 -79 | 1,046 -6 | 1,073 56 | 278 10 | 795 46 |
| 2014-15 | 3,178 -77 | 2,138 -44 | 1,108 -28 | 1,030 -16 | 1,040 -33 | 290 12 | 750 -45 |
| 2015-16 | 3,241 63 | 2,147 9 | 1,062 -46 | 1,085 55 | 1,094 54 | 315 25 | 779 29 |
| 2016-17 | 3,144 -97 | 2,114 -33 | 1,063 1 | 1,051 -34 | 1,030 -64 | 299 -16 | 731 -48 |
| 2017-18 | 3,246 102 | 2,227 113 | 1,130 67 | 1,097 46 | 1,019 -11 | 300 1 | 719 -12 |
| 2018-19 | 3,139 -107 | 2,129 -98 | 1,071 -59 | 1,058 -39 | 1,010 -9 | 276 -24 | 734 15 |
| 2019-20 | 3,110 -29 | 2,175 46 | 1,093 22 | 1,082 24 | 935 -75 | 254 -22 | 681 -53 |
| 2020-21 | 3,068 -42 | 2,188 13 | 1,071 -22 | 1,117 35 | 880 -55 | 240 -14 | 640 -41 |
| 2021-22 | 2,965 -103 | 2,059 -129 | 1,016 -55 | 1,043 -74 | 906 26 | 278 38 | 628 -12 |
| 2022-23 | 2,921 -44 | 2,005 -54 | 1,005 -11 | 1,000 -43 | 916 10 | 278 0 | 638 10 |
| Average | 3,141 | 2,148 | 1,088 | 1,060 | 993 | 280 | 713 |