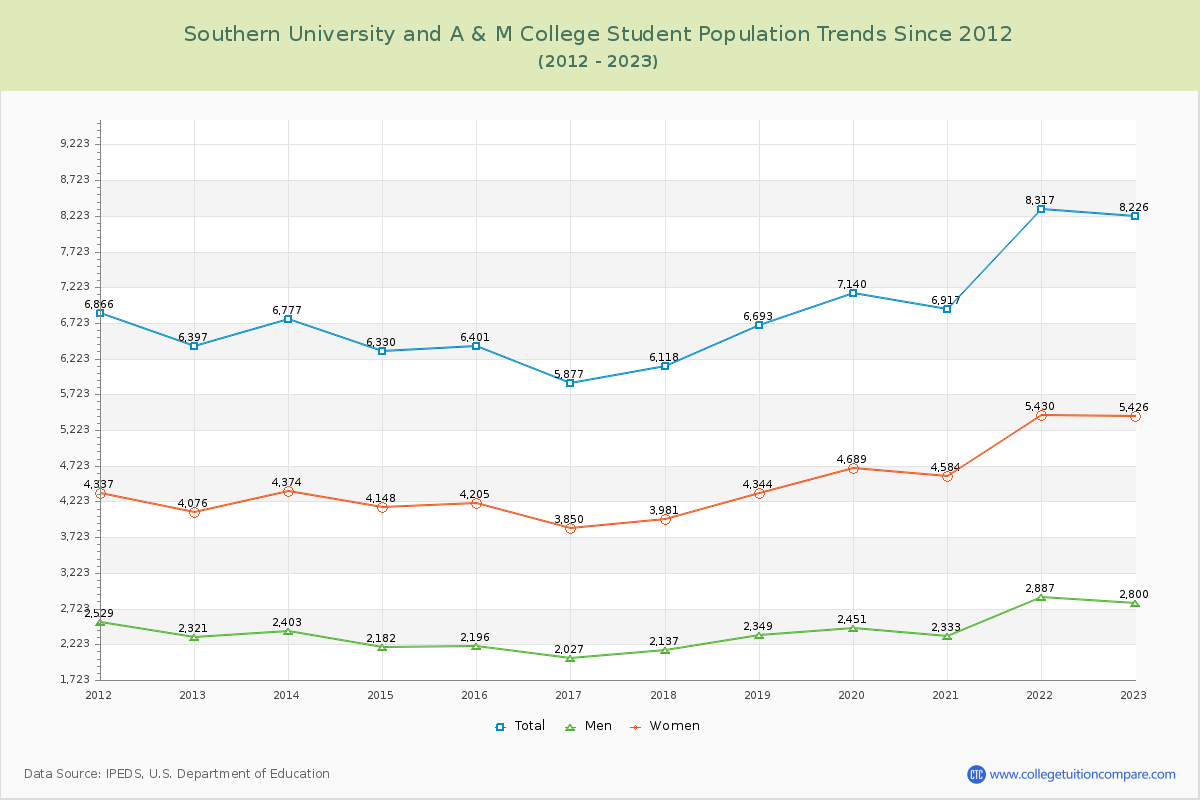
Student Population Changes
The average student population over the last 12 years is 6,836 where 8,226 students are attending the school for the academic year 2022-2023.
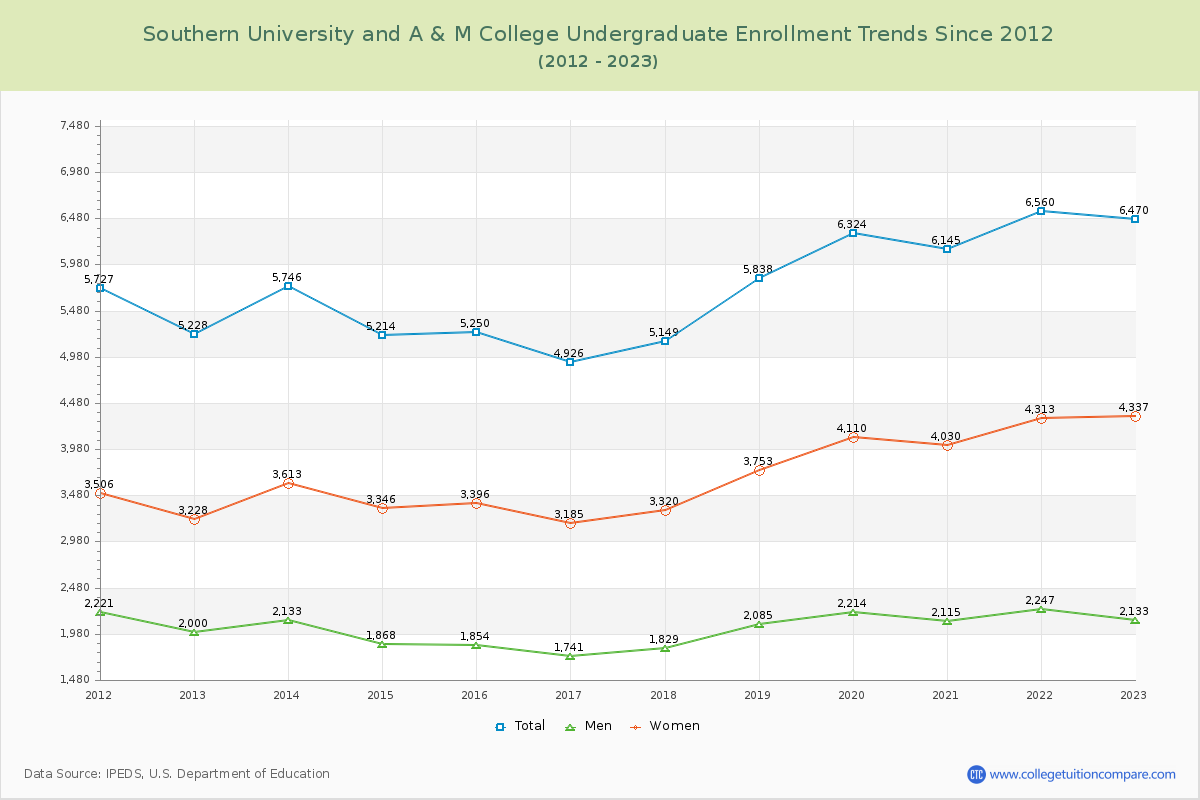
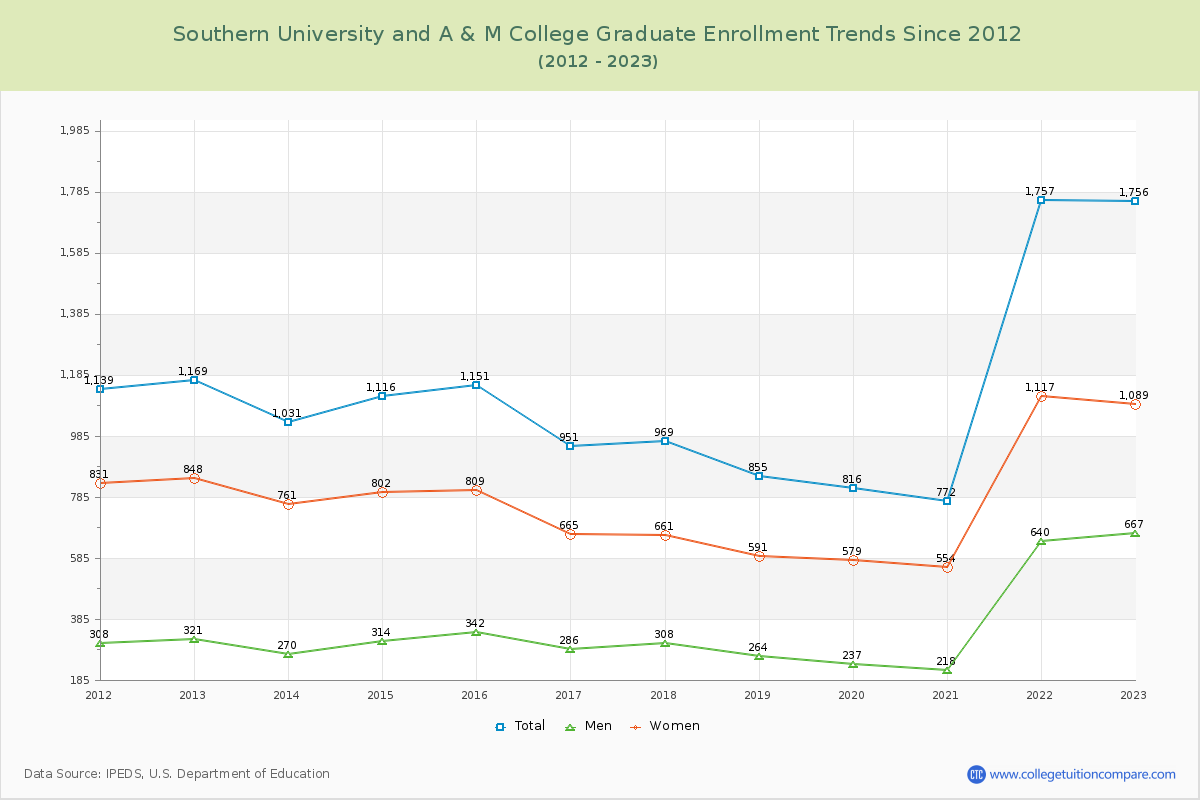
78.65% of total students is undergraduate students and 21.35% students is graduate students. The number of undergraduate students has increased by 1,242 and the graduate enrollment has increased by 587 over past 10 years.
The female to male ratio is 1.94 to 1 and it means that there are more female students enrolled in Southern University and A & M than male students.
The following table and chart illustrate the changes in student population by gender at Southern University and A & M College since 2012.
| Year | Total | Undergraduate | Graduate | ||||
|---|---|---|---|---|---|---|---|
| Total | Men | Women | Total | Men | Women | ||
| 2012-13 | 6,397 | 5,228 | 2,000 | 3,228 | 1,169 | 321 | 848 |
| 2013-14 | 6,777 380 | 5,746 518 | 2,133 133 | 3,613 385 | 1,031 -138 | 270 -51 | 761 -87 |
| 2014-15 | 6,330 -447 | 5,214 -532 | 1,868 -265 | 3,346 -267 | 1,116 85 | 314 44 | 802 41 |
| 2015-16 | 6,401 71 | 5,250 36 | 1,854 -14 | 3,396 50 | 1,151 35 | 342 28 | 809 7 |
| 2016-17 | 5,877 -524 | 4,926 -324 | 1,741 -113 | 3,185 -211 | 951 -200 | 286 -56 | 665 -144 |
| 2017-18 | 6,118 241 | 5,149 223 | 1,829 88 | 3,320 135 | 969 18 | 308 22 | 661 -4 |
| 2018-19 | 6,693 575 | 5,838 689 | 2,085 256 | 3,753 433 | 855 -114 | 264 -44 | 591 -70 |
| 2019-20 | 7,140 447 | 6,324 486 | 2,214 129 | 4,110 357 | 816 -39 | 237 -27 | 579 -12 |
| 2020-21 | 6,917 -223 | 6,145 -179 | 2,115 -99 | 4,030 -80 | 772 -44 | 218 -19 | 554 -25 |
| 2021-22 | 8,317 1,400 | 6,560 415 | 2,247 132 | 4,313 283 | 1,757 985 | 640 422 | 1,117 563 |
| 2022-23 | 8,226 -91 | 6,470 -90 | 2,133 -114 | 4,337 24 | 1,756 -1 | 667 27 | 1,089 -28 |
| Average | 6,836 | 5,714 | 2,020 | 3,694 | 1,122 | 352 | 771 |