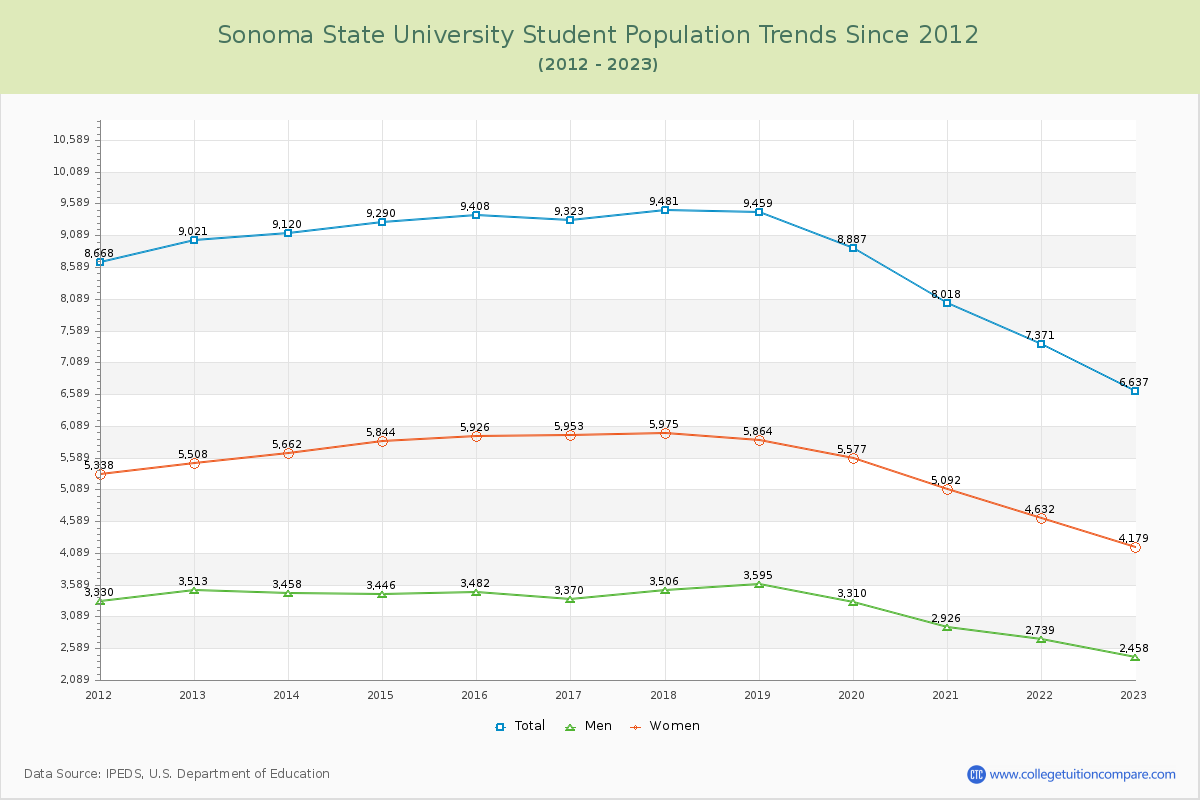
Student Population Changes
The average student population over the last 12 years is 8,729 where 6,637 students are attending the school for the academic year 2022-2023.
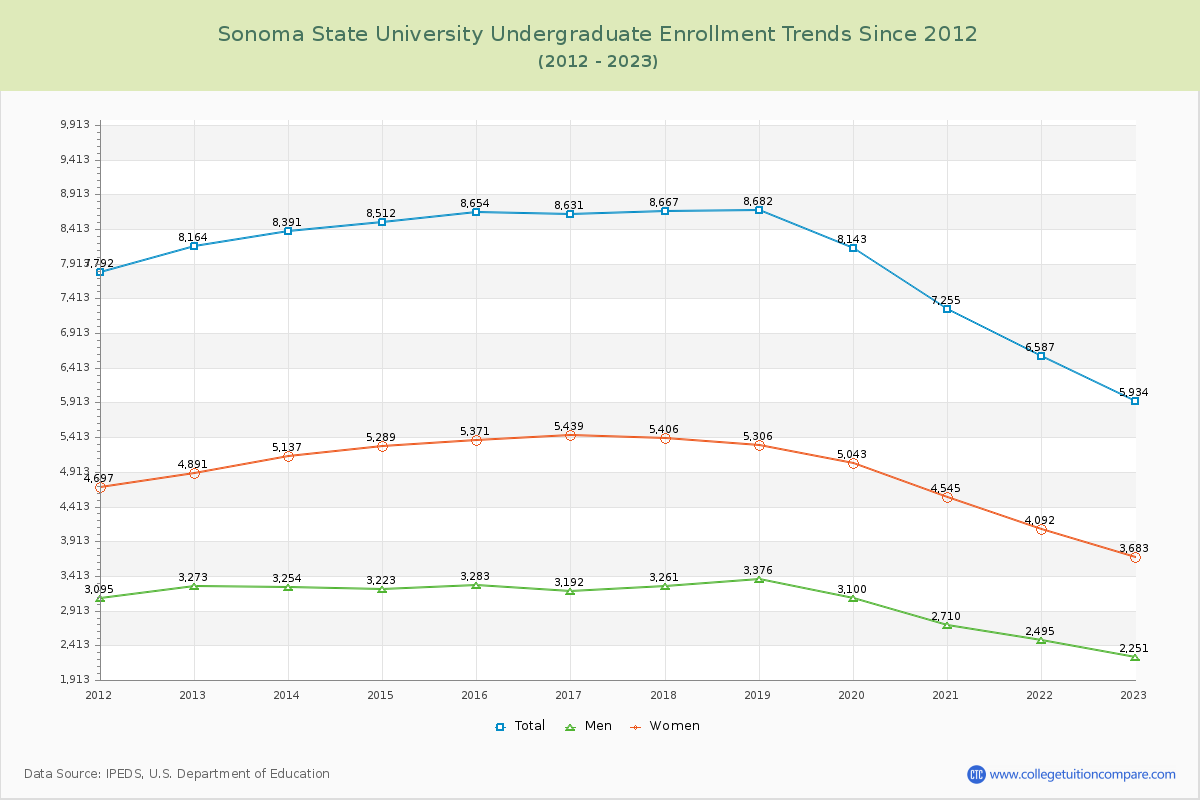
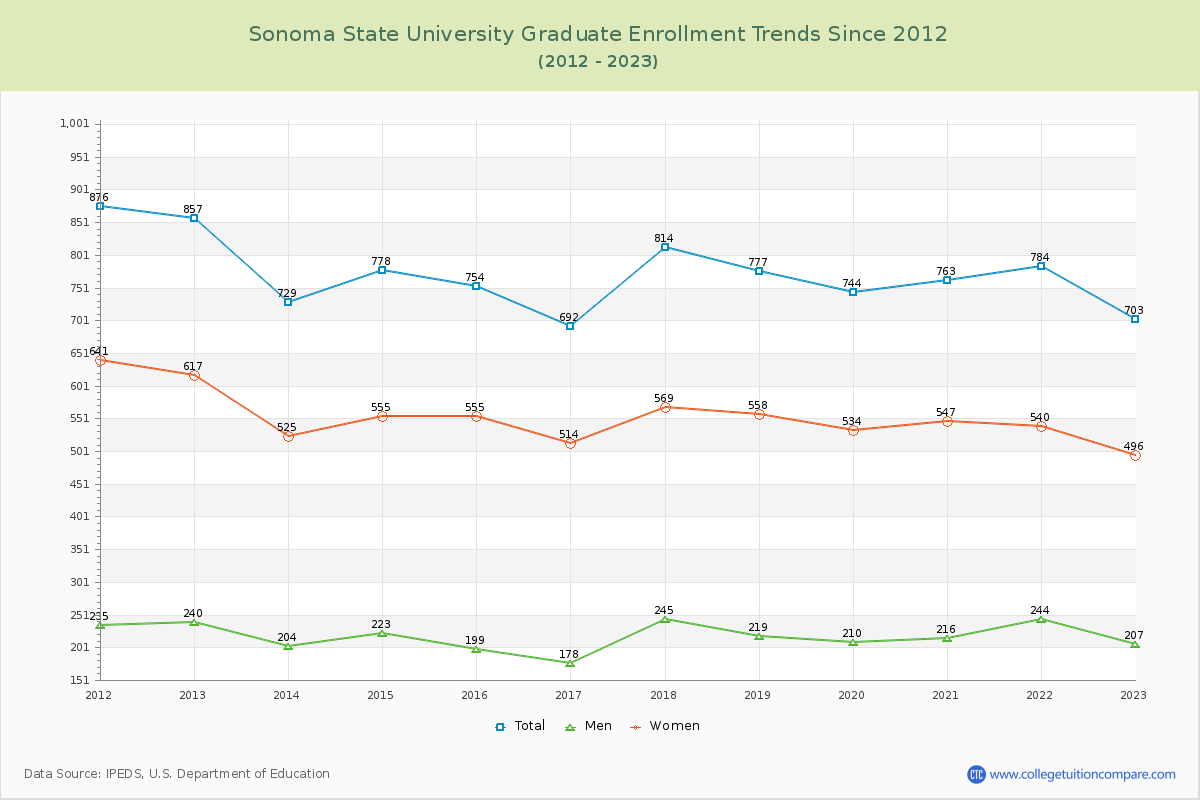
89.41% of total students is undergraduate students and 10.59% students is graduate students. The number of undergraduate students has decreased by 2,230 and the graduate enrollment has decreased by 154 over past 10 years.
The female to male ratio is 1.70 to 1 and it means that there are more female students enrolled in Sonoma State than male students.
The following table and chart illustrate the changes in student population by gender at Sonoma State University since 2012.
| Year | Total | Undergraduate | Graduate | ||||
|---|---|---|---|---|---|---|---|
| Total | Men | Women | Total | Men | Women | ||
| 2012-13 | 9,021 | 8,164 | 3,273 | 4,891 | 857 | 240 | 617 |
| 2013-14 | 9,120 99 | 8,391 227 | 3,254 -19 | 5,137 246 | 729 -128 | 204 -36 | 525 -92 |
| 2014-15 | 9,290 170 | 8,512 121 | 3,223 -31 | 5,289 152 | 778 49 | 223 19 | 555 30 |
| 2015-16 | 9,408 118 | 8,654 142 | 3,283 60 | 5,371 82 | 754 -24 | 199 -24 | 555 0 |
| 2016-17 | 9,323 -85 | 8,631 -23 | 3,192 -91 | 5,439 68 | 692 -62 | 178 -21 | 514 -41 |
| 2017-18 | 9,481 158 | 8,667 36 | 3,261 69 | 5,406 -33 | 814 122 | 245 67 | 569 55 |
| 2018-19 | 9,459 -22 | 8,682 15 | 3,376 115 | 5,306 -100 | 777 -37 | 219 -26 | 558 -11 |
| 2019-20 | 8,887 -572 | 8,143 -539 | 3,100 -276 | 5,043 -263 | 744 -33 | 210 -9 | 534 -24 |
| 2020-21 | 8,018 -869 | 7,255 -888 | 2,710 -390 | 4,545 -498 | 763 19 | 216 6 | 547 13 |
| 2021-22 | 7,371 -647 | 6,587 -668 | 2,495 -215 | 4,092 -453 | 784 21 | 244 28 | 540 -7 |
| 2022-23 | 6,637 -734 | 5,934 -653 | 2,251 -244 | 3,683 -409 | 703 -81 | 207 -37 | 496 -44 |
| Average | 8,729 | 7,965 | 3,038 | 4,927 | 763 | 217 | 546 |