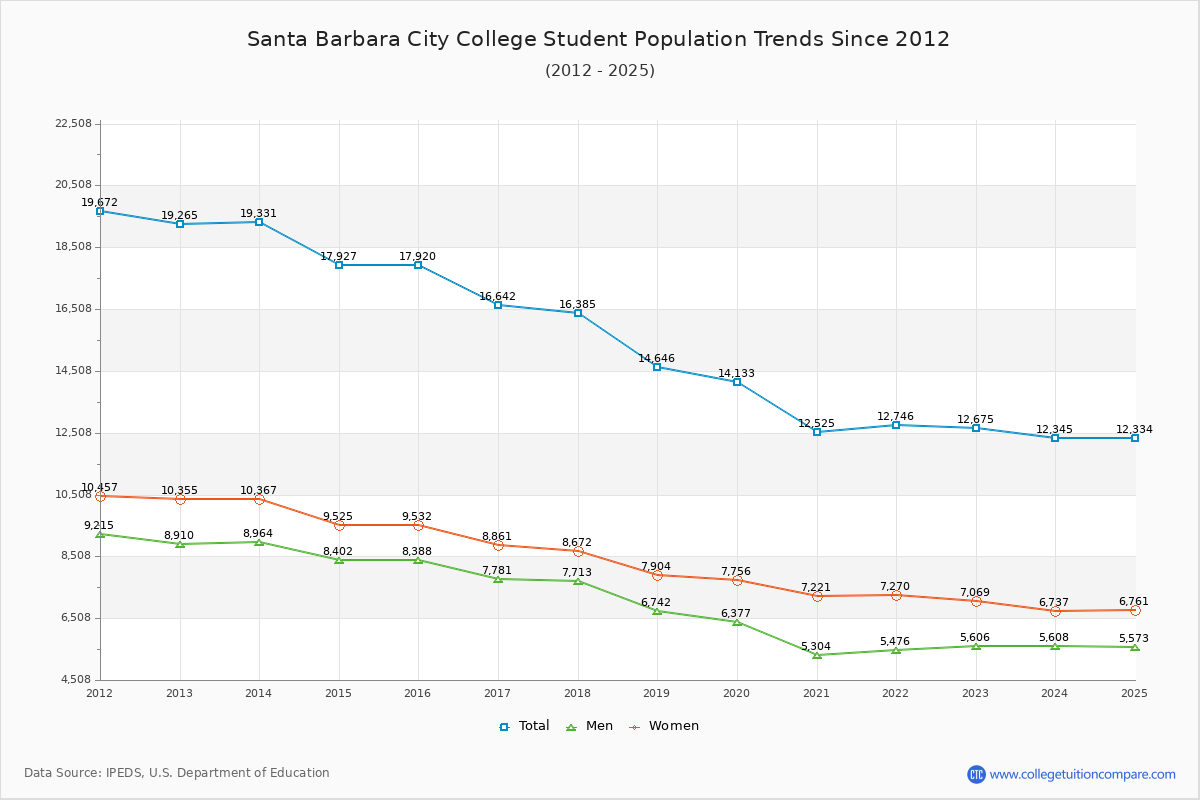
Student Population Changes
The average student population over the last 12 years is 15,836 where 12,675 students are attending the school for the academic year 2022-2023.
The female to male ratio is 1.26 to 1 and it means that there are slightly more female students enrolled in SBCC than male students.
The following table and chart illustrate the changes in student population by gender at Santa Barbara City College since 2012.
| Year | Total | Men | Women |
|---|---|---|---|
| 2012-13 | 19,265 | 8,910 | 10,355 |
| 2013-14 | 19,331 66 | 8,964 54 | 10,367 12 |
| 2014-15 | 17,927 -1,404 | 8,402 -562 | 9,525 -842 |
| 2015-16 | 17,920 -7 | 8,388 -14 | 9,532 7 |
| 2016-17 | 16,642 -1,278 | 7,781 -607 | 8,861 -671 |
| 2017-18 | 16,385 -257 | 7,713 -68 | 8,672 -189 |
| 2018-19 | 14,646 -1,739 | 6,742 -971 | 7,904 -768 |
| 2019-20 | 14,133 -513 | 6,377 -365 | 7,756 -148 |
| 2020-21 | 12,525 -1,608 | 5,304 -1,073 | 7,221 -535 |
| 2021-22 | 12,746 221 | 5,476 172 | 7,270 49 |
| 2022-23 | 12,675 -71 | 5,606 130 | 7,069 -201 |
| Average | 15,836 | 7,242 | 8,594 |