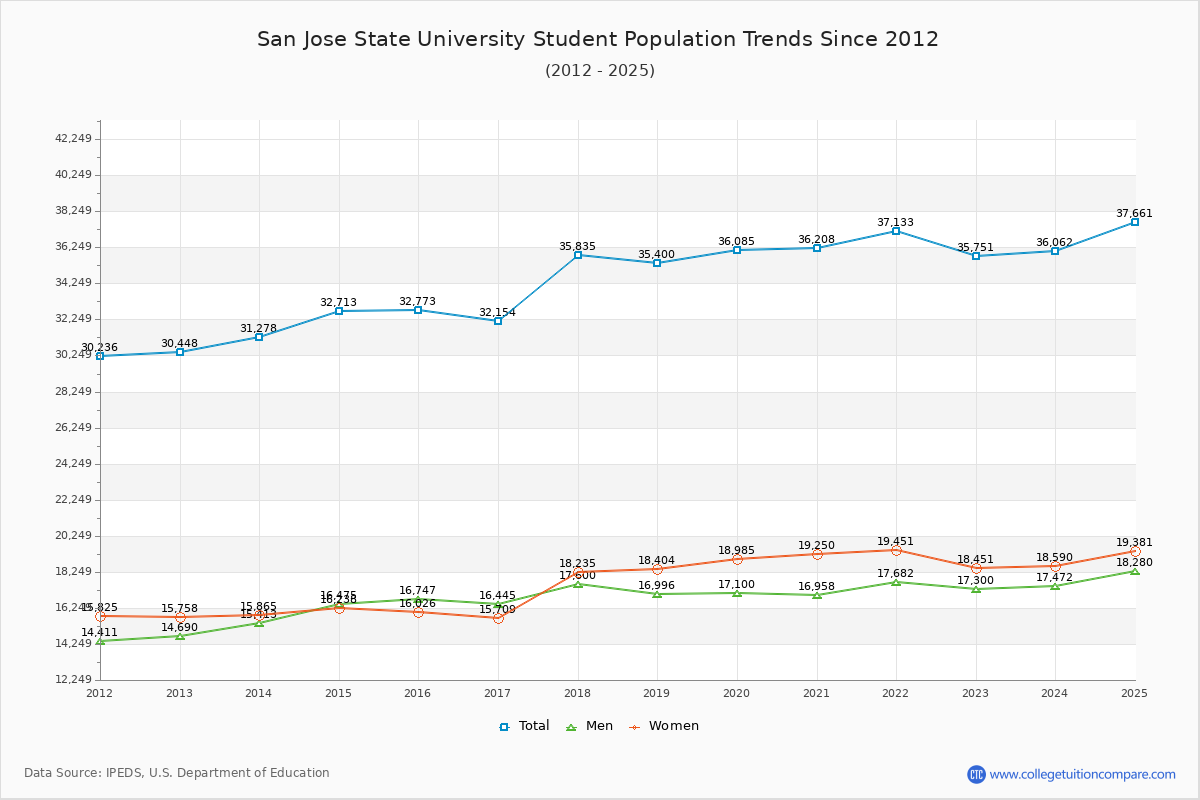
Student Population Changes
The average student population over the last 12 years is 34,162 where 35,751 students are attending the school for the academic year 2022-2023.
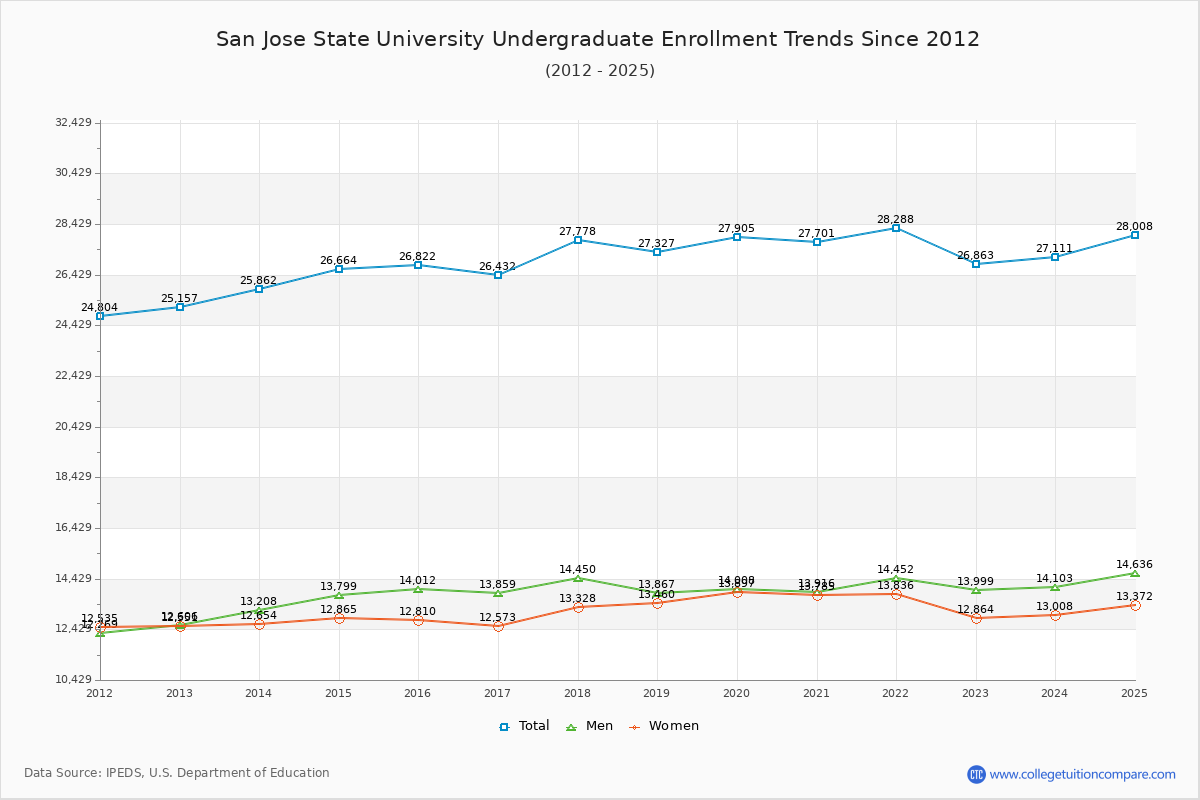
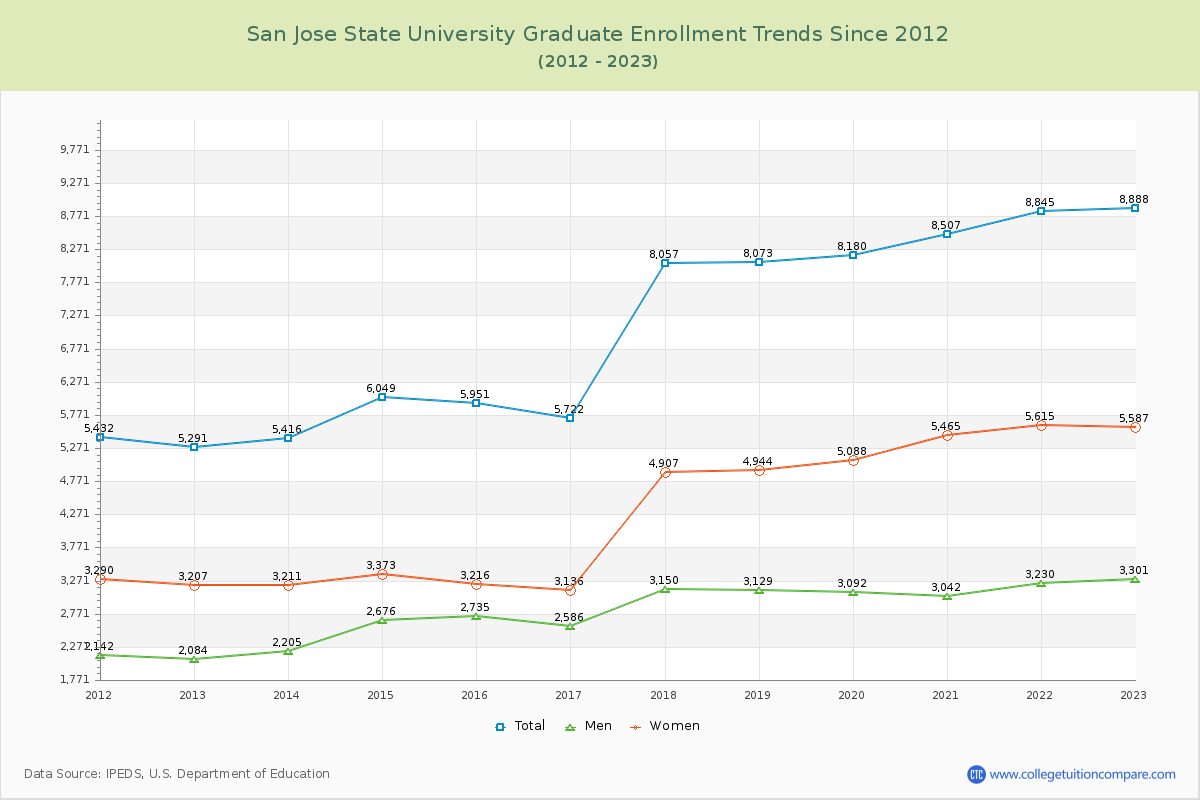
75.14% of total students is undergraduate students and 24.86% students is graduate students. The number of undergraduate students has increased by 1,706 and the graduate enrollment has increased by 3,597 over past 10 years.
The female to male ratio is 1.07 to 1 and it means that there are similar numbers of female and male students enrolled in San Jose State.
The following table and chart illustrate the changes in student population by gender at San Jose State University since 2012.
| Year | Total | Undergraduate | Graduate | ||||
|---|---|---|---|---|---|---|---|
| Total | Men | Women | Total | Men | Women | ||
| 2012-13 | 30,448 | 25,157 | 12,606 | 12,551 | 5,291 | 2,084 | 3,207 |
| 2013-14 | 31,278 830 | 25,862 705 | 13,208 602 | 12,654 103 | 5,416 125 | 2,205 121 | 3,211 4 |
| 2014-15 | 32,713 1,435 | 26,664 802 | 13,799 591 | 12,865 211 | 6,049 633 | 2,676 471 | 3,373 162 |
| 2015-16 | 32,773 60 | 26,822 158 | 14,012 213 | 12,810 -55 | 5,951 -98 | 2,735 59 | 3,216 -157 |
| 2016-17 | 32,154 -619 | 26,432 -390 | 13,859 -153 | 12,573 -237 | 5,722 -229 | 2,586 -149 | 3,136 -80 |
| 2017-18 | 35,835 3,681 | 27,778 1,346 | 14,450 591 | 13,328 755 | 8,057 2,335 | 3,150 564 | 4,907 1,771 |
| 2018-19 | 35,400 -435 | 27,327 -451 | 13,867 -583 | 13,460 132 | 8,073 16 | 3,129 -21 | 4,944 37 |
| 2019-20 | 36,085 685 | 27,905 578 | 14,008 141 | 13,897 437 | 8,180 107 | 3,092 -37 | 5,088 144 |
| 2020-21 | 36,208 123 | 27,701 -204 | 13,916 -92 | 13,785 -112 | 8,507 327 | 3,042 -50 | 5,465 377 |
| 2021-22 | 37,133 925 | 28,288 587 | 14,452 536 | 13,836 51 | 8,845 338 | 3,230 188 | 5,615 150 |
| 2022-23 | 35,751 -1,382 | 26,863 -1,425 | 13,999 -453 | 12,864 -972 | 8,888 43 | 3,301 71 | 5,587 -28 |
| Average | 34,162 | 26,982 | 13,834 | 13,148 | 7,180 | 2,839 | 4,341 |