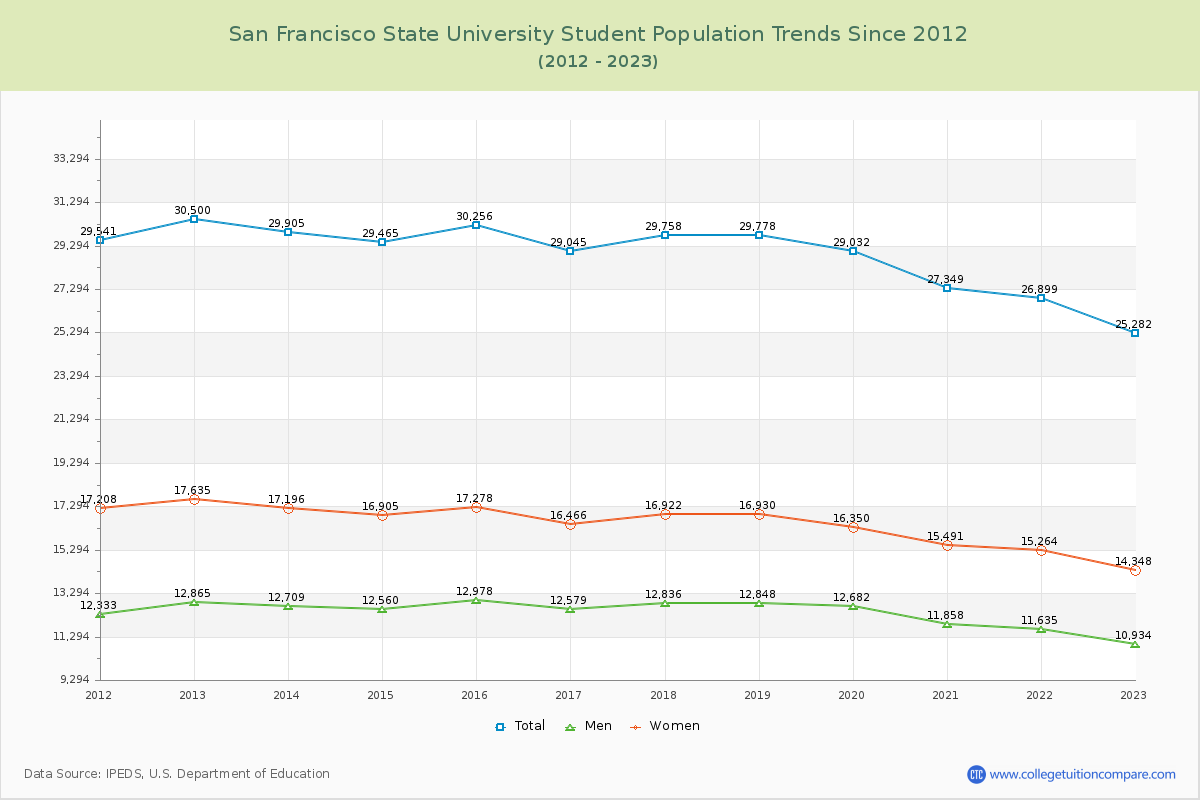
Student Population Changes
The average student population over the last 12 years is 28,843 where 25,282 students are attending the school for the academic year 2022-2023.
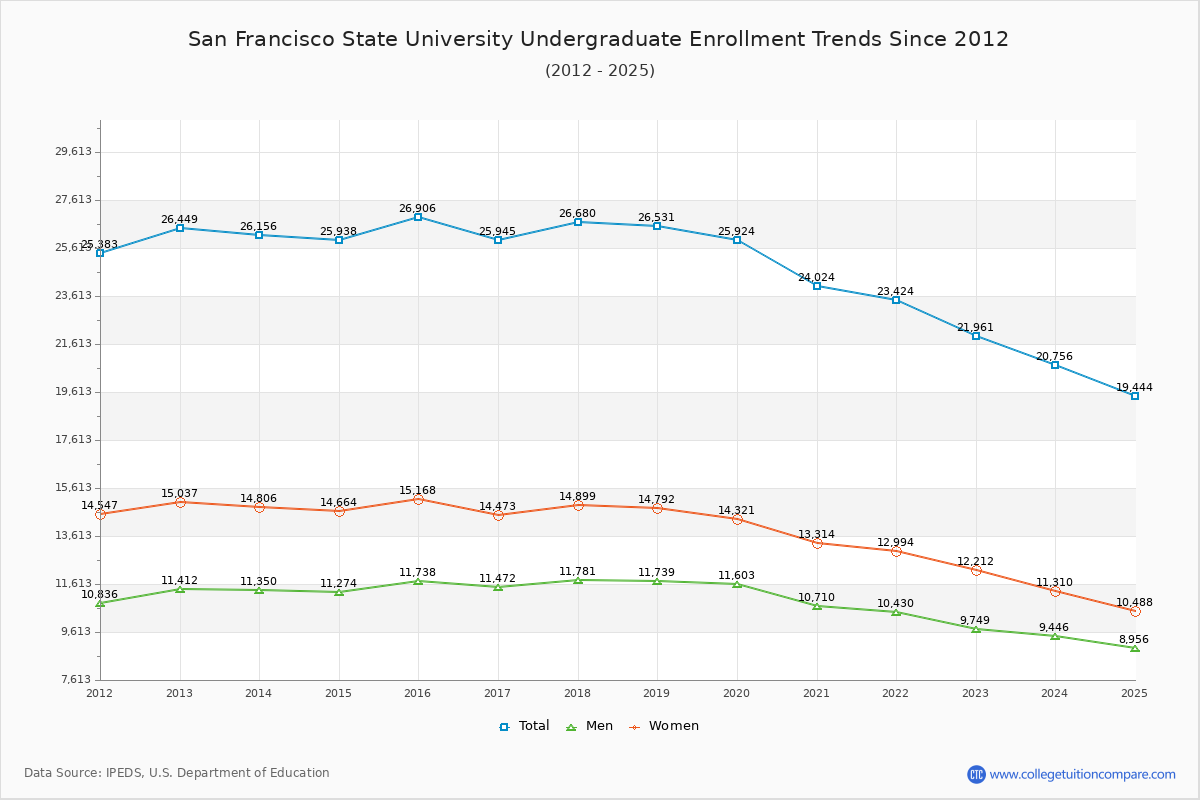
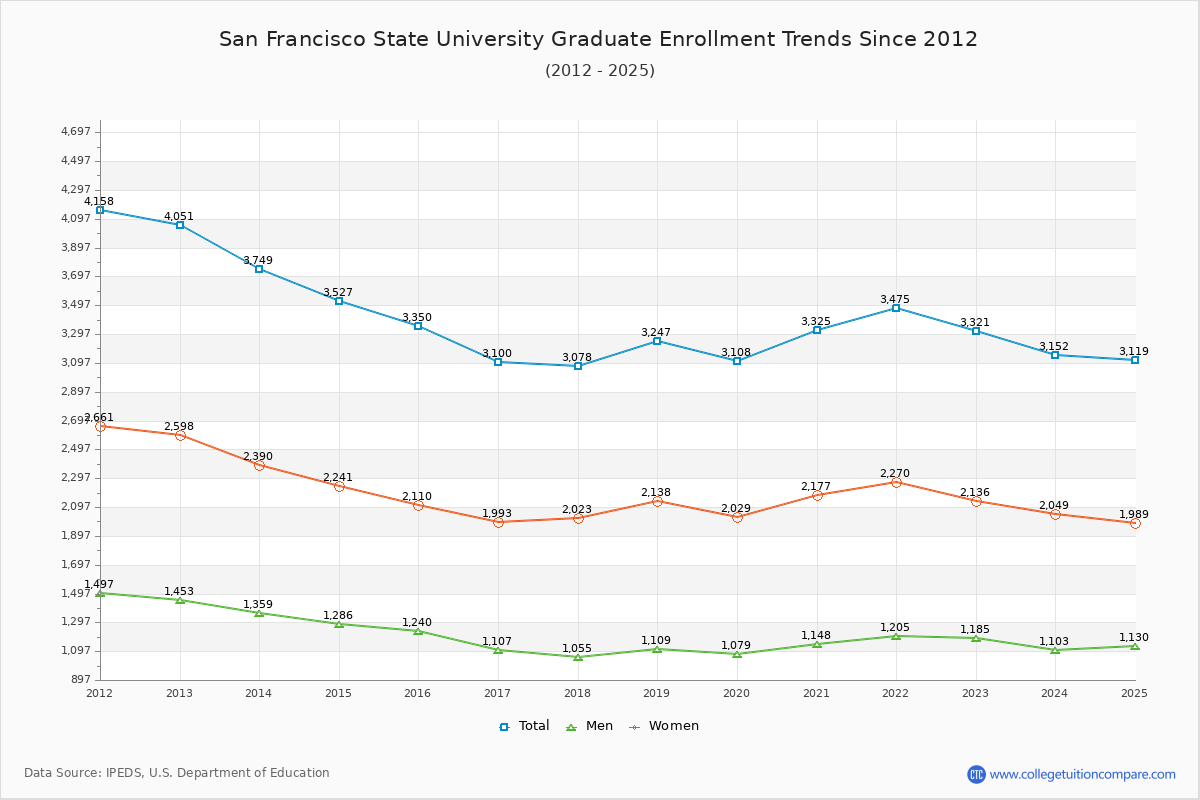
86.86% of total students is undergraduate students and 13.14% students is graduate students. The number of undergraduate students has decreased by 4,488 and the graduate enrollment has decreased by 730 over past 10 years.
The female to male ratio is 1.31 to 1 and it means that there are more female students enrolled in San Francisco State than male students.
The following table and chart illustrate the changes in student population by gender at San Francisco State University since 2012.
| Year | Total | Undergraduate | Graduate | ||||
|---|---|---|---|---|---|---|---|
| Total | Men | Women | Total | Men | Women | ||
| 2012-13 | 30,500 | 26,449 | 11,412 | 15,037 | 4,051 | 1,453 | 2,598 |
| 2013-14 | 29,905 -595 | 26,156 -293 | 11,350 -62 | 14,806 -231 | 3,749 -302 | 1,359 -94 | 2,390 -208 |
| 2014-15 | 29,465 -440 | 25,938 -218 | 11,274 -76 | 14,664 -142 | 3,527 -222 | 1,286 -73 | 2,241 -149 |
| 2015-16 | 30,256 791 | 26,906 968 | 11,738 464 | 15,168 504 | 3,350 -177 | 1,240 -46 | 2,110 -131 |
| 2016-17 | 29,045 -1,211 | 25,945 -961 | 11,472 -266 | 14,473 -695 | 3,100 -250 | 1,107 -133 | 1,993 -117 |
| 2017-18 | 29,758 713 | 26,680 735 | 11,781 309 | 14,899 426 | 3,078 -22 | 1,055 -52 | 2,023 30 |
| 2018-19 | 29,778 20 | 26,531 -149 | 11,739 -42 | 14,792 -107 | 3,247 169 | 1,109 54 | 2,138 115 |
| 2019-20 | 29,032 -746 | 25,924 -607 | 11,603 -136 | 14,321 -471 | 3,108 -139 | 1,079 -30 | 2,029 -109 |
| 2020-21 | 27,349 -1,683 | 24,024 -1,900 | 10,710 -893 | 13,314 -1,007 | 3,325 217 | 1,148 69 | 2,177 148 |
| 2021-22 | 26,899 -450 | 23,424 -600 | 10,430 -280 | 12,994 -320 | 3,475 150 | 1,205 57 | 2,270 93 |
| 2022-23 | 25,282 -1,617 | 21,961 -1,463 | 9,749 -681 | 12,212 -782 | 3,321 -154 | 1,185 -20 | 2,136 -134 |
| Average | 28,843 | 25,449 | 11,205 | 14,244 | 3,394 | 1,202 | 2,191 |