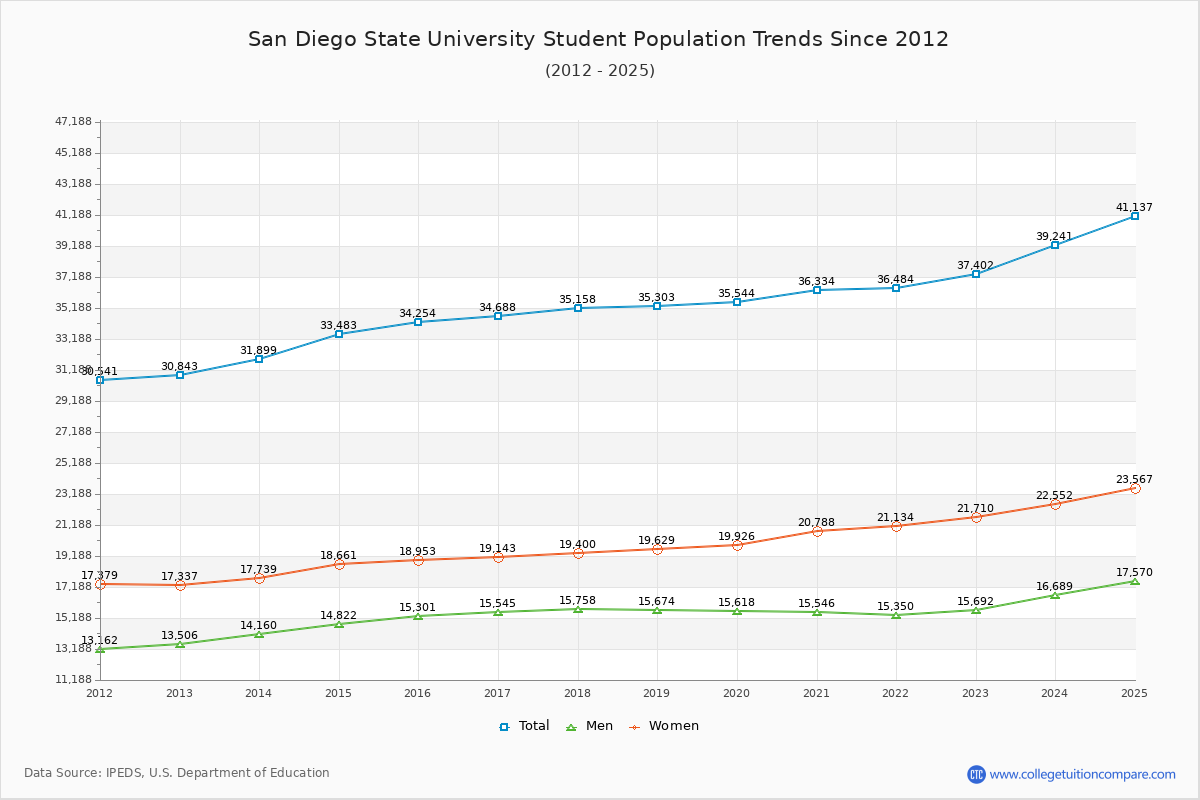
Student Population Changes
The average student population over the last 12 years is 34,672 where 37,402 students are attending the school for the academic year 2022-2023.
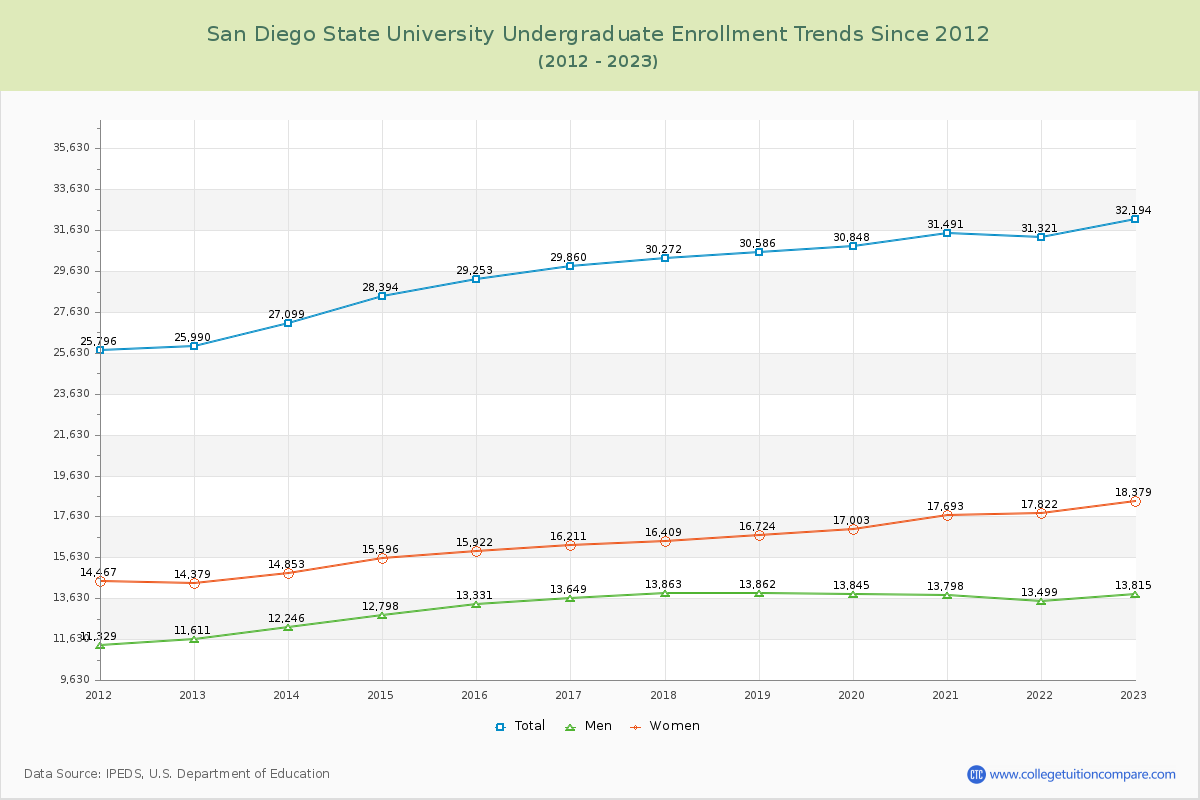
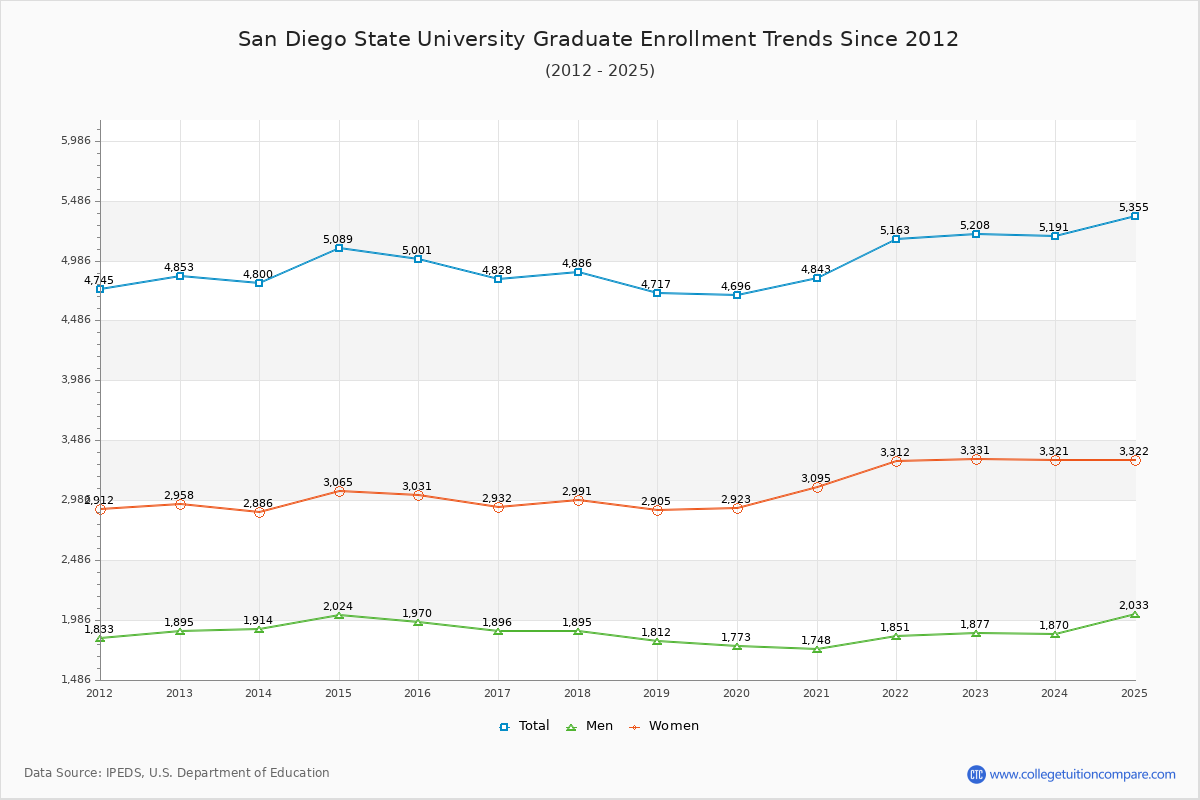
86.08% of total students is undergraduate students and 13.92% students is graduate students. The number of undergraduate students has increased by 6,204 and the graduate enrollment has increased by 355 over past 10 years.
The female to male ratio is 1.38 to 1 and it means that there are more female students enrolled in San Diego State than male students.
The following table and chart illustrate the changes in student population by gender at San Diego State University since 2012.
| Year | Total | Undergraduate | Graduate | ||||
|---|---|---|---|---|---|---|---|
| Total | Men | Women | Total | Men | Women | ||
| 2012-13 | 30,843 | 25,990 | 11,611 | 14,379 | 4,853 | 1,895 | 2,958 |
| 2013-14 | 31,899 1,056 | 27,099 1,109 | 12,246 635 | 14,853 474 | 4,800 -53 | 1,914 19 | 2,886 -72 |
| 2014-15 | 33,483 1,584 | 28,394 1,295 | 12,798 552 | 15,596 743 | 5,089 289 | 2,024 110 | 3,065 179 |
| 2015-16 | 34,254 771 | 29,253 859 | 13,331 533 | 15,922 326 | 5,001 -88 | 1,970 -54 | 3,031 -34 |
| 2016-17 | 34,688 434 | 29,860 607 | 13,649 318 | 16,211 289 | 4,828 -173 | 1,896 -74 | 2,932 -99 |
| 2017-18 | 35,158 470 | 30,272 412 | 13,863 214 | 16,409 198 | 4,886 58 | 1,895 -1 | 2,991 59 |
| 2018-19 | 35,303 145 | 30,586 314 | 13,862 -1 | 16,724 315 | 4,717 -169 | 1,812 -83 | 2,905 -86 |
| 2019-20 | 35,544 241 | 30,848 262 | 13,845 -17 | 17,003 279 | 4,696 -21 | 1,773 -39 | 2,923 18 |
| 2020-21 | 36,334 790 | 31,491 643 | 13,798 -47 | 17,693 690 | 4,843 147 | 1,748 -25 | 3,095 172 |
| 2021-22 | 36,484 150 | 31,321 -170 | 13,499 -299 | 17,822 129 | 5,163 320 | 1,851 103 | 3,312 217 |
| 2022-23 | 37,402 918 | 32,194 873 | 13,815 316 | 18,379 557 | 5,208 45 | 1,877 26 | 3,331 19 |
| Average | 34,672 | 29,755 | 13,302 | 16,454 | 4,917 | 1,878 | 3,039 |