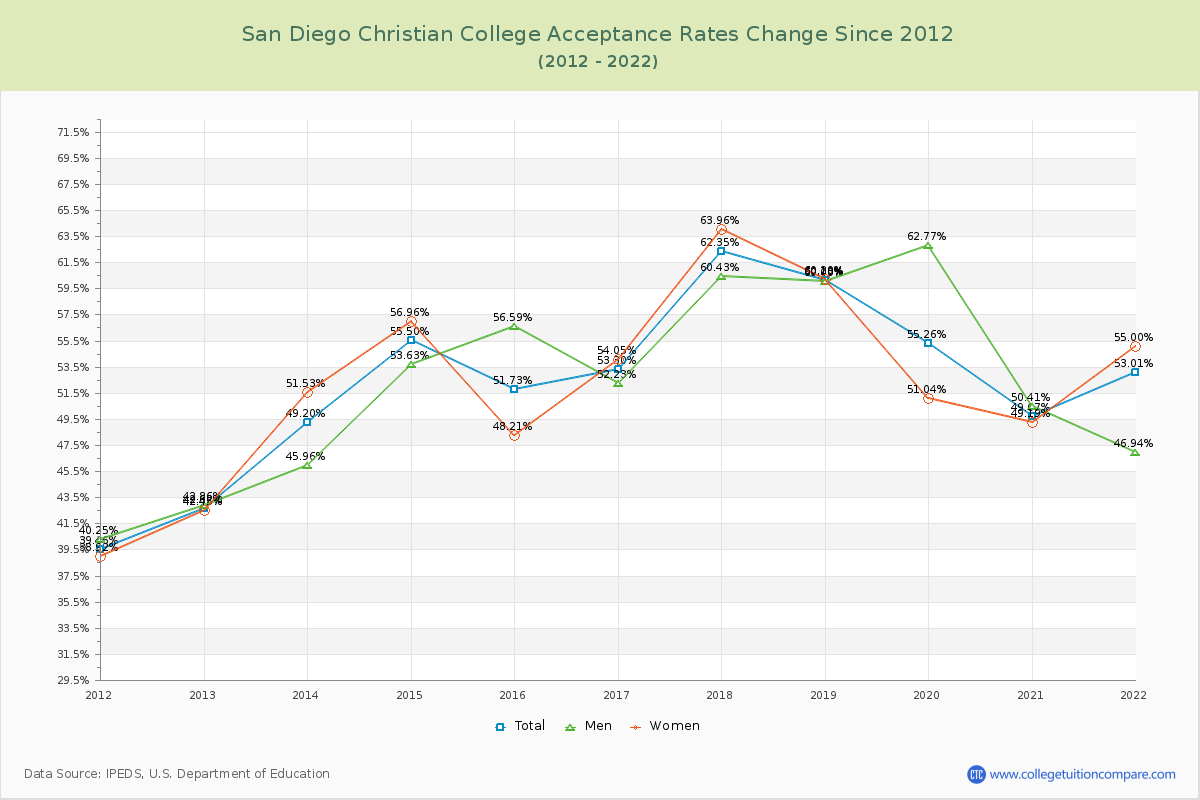
Acceptance Rate Changes
The average acceptance rate over the last 10 years is 53.28%, and this year's acceptance rate is 53.01% at San Diego Christian College. By gender, men students' acceptance rate is 53.18% and women students' rate is 53.26%.
The next table and chart illustrate the acceptance rates changes at San Diego Christian College over the past 10 years (2012-2022).
| Year | Total | Men | Women |
|---|---|---|---|
| 2012-13 | 42.62% | 42.86% | 42.45% |
| 2013-14 | 49.20% 6.58% |
45.96% 9.08% |
51.53% 9.08% |
| 2014-15 | 55.50% 6.30% |
53.63% 5.42% |
56.96% 5.42% |
| 2015-16 | 51.73% -3.77% |
56.59% -8.75% |
48.21% -8.75% |
| 2016-17 | 53.30% 1.57% |
52.23% 5.85% |
54.05% 5.85% |
| 2017-18 | 62.35% 9.05% |
60.43% 9.91% |
63.96% 9.91% |
| 2018-19 | 60.13% -2.22% |
60.00% -3.76% |
60.20% -3.76% |
| 2019-20 | 55.26% -4.87% |
62.77% -9.16% |
51.04% -9.16% |
| 2020-21 | 49.67% -5.58% |
50.41% -1.85% |
49.19% -1.85% |
| 2021-22 | 53.01% 3.34% |
46.94% 5.81% |
55.00% 5.81% |
| Average | 53.28% | 53.18% | 53.26% |