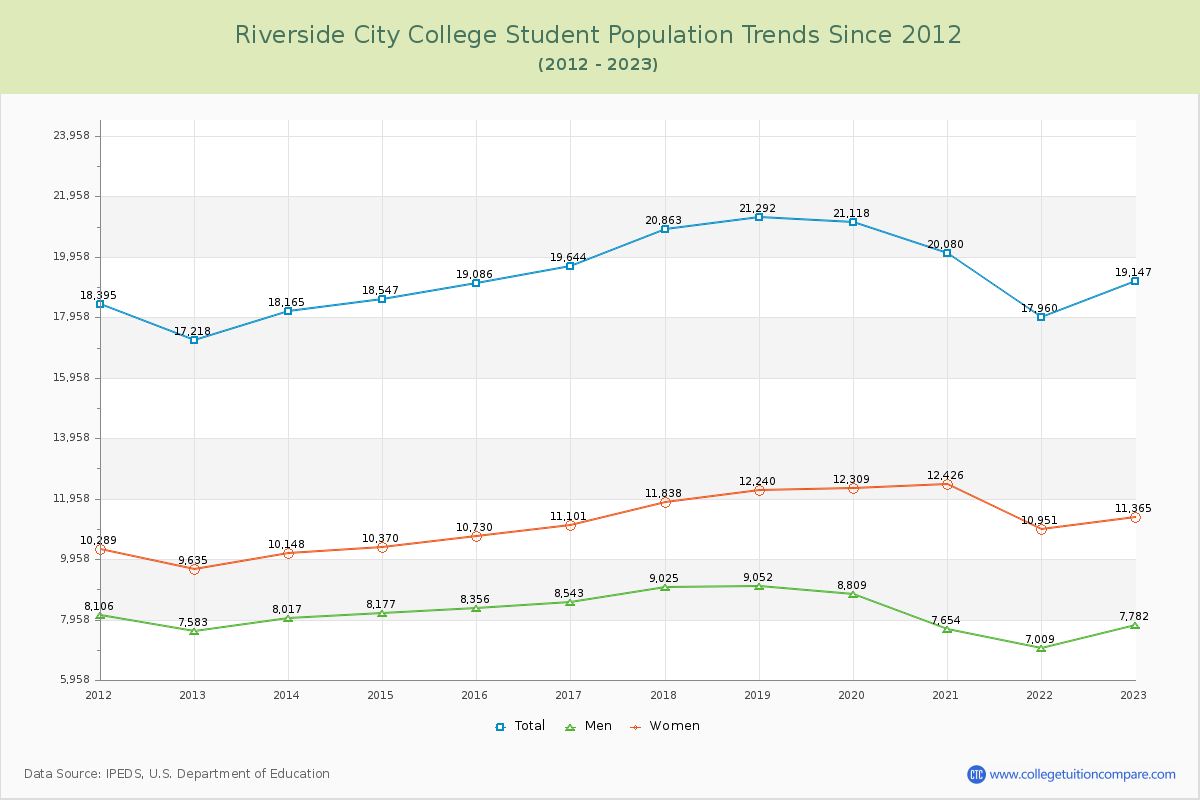
Student Population Changes
The average student population over the last 12 years is 19,375 where 19,147 students are attending the school for the academic year 2022-2023.
The female to male ratio is 1.46 to 1 and it means that there are more female students enrolled in Riverside City than male students.
The following table and chart illustrate the changes in student population by gender at Riverside City College since 2012.
| Year | Total | Men | Women |
|---|---|---|---|
| 2012-13 | 17,218 | 7,583 | 9,635 |
| 2013-14 | 18,165 947 | 8,017 434 | 10,148 513 |
| 2014-15 | 18,547 382 | 8,177 160 | 10,370 222 |
| 2015-16 | 19,086 539 | 8,356 179 | 10,730 360 |
| 2016-17 | 19,644 558 | 8,543 187 | 11,101 371 |
| 2017-18 | 20,863 1,219 | 9,025 482 | 11,838 737 |
| 2018-19 | 21,292 429 | 9,052 27 | 12,240 402 |
| 2019-20 | 21,118 -174 | 8,809 -243 | 12,309 69 |
| 2020-21 | 20,080 -1,038 | 7,654 -1,155 | 12,426 117 |
| 2021-22 | 17,960 -2,120 | 7,009 -645 | 10,951 -1,475 |
| 2022-23 | 19,147 1,187 | 7,782 773 | 11,365 414 |
| Average | 19,375 | 8,182 | 11,192 |