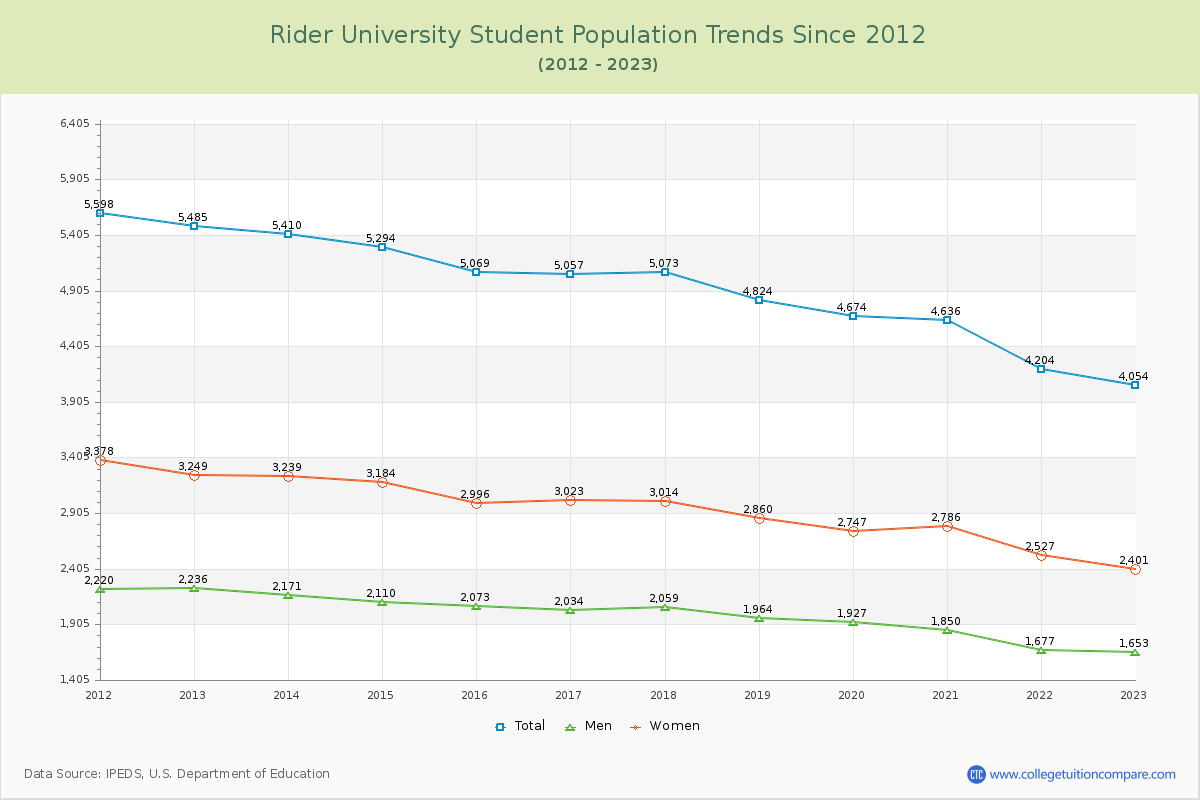
Student Population Changes
The average student population over the last 12 years is 4,889 where 4,054 students are attending the school for the academic year 2022-2023.
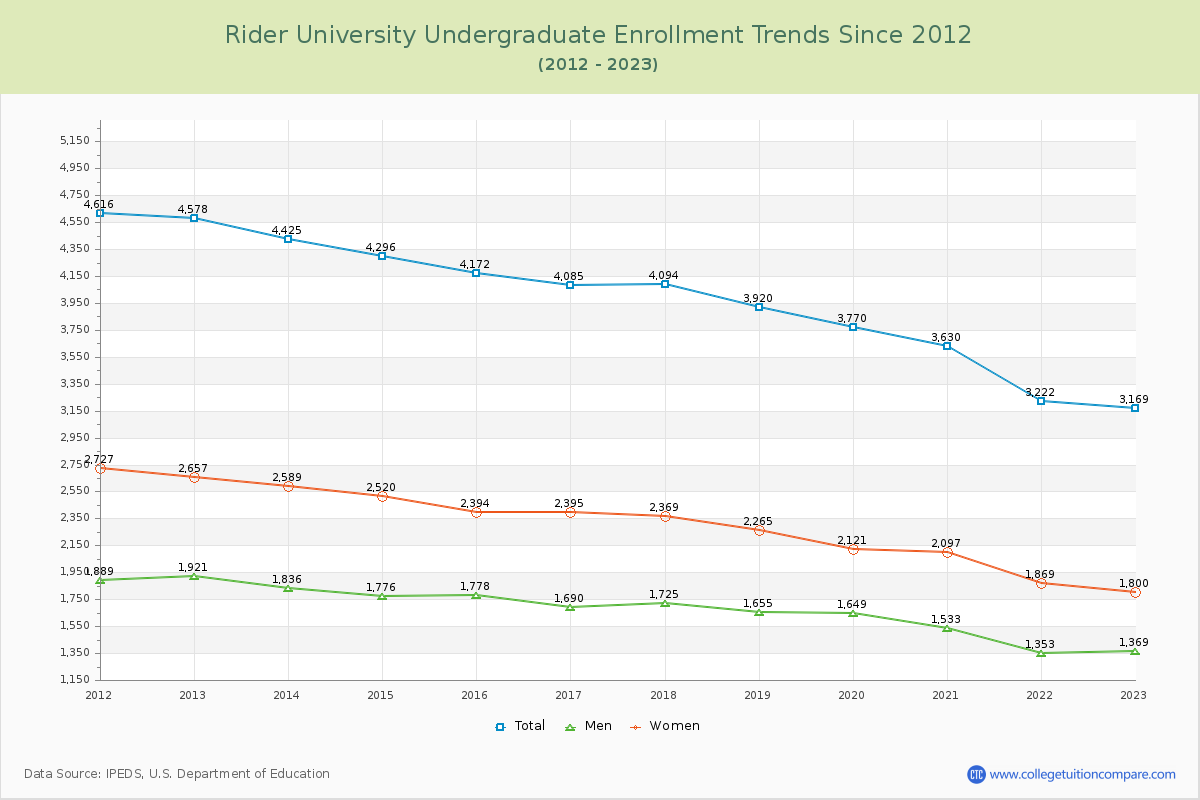
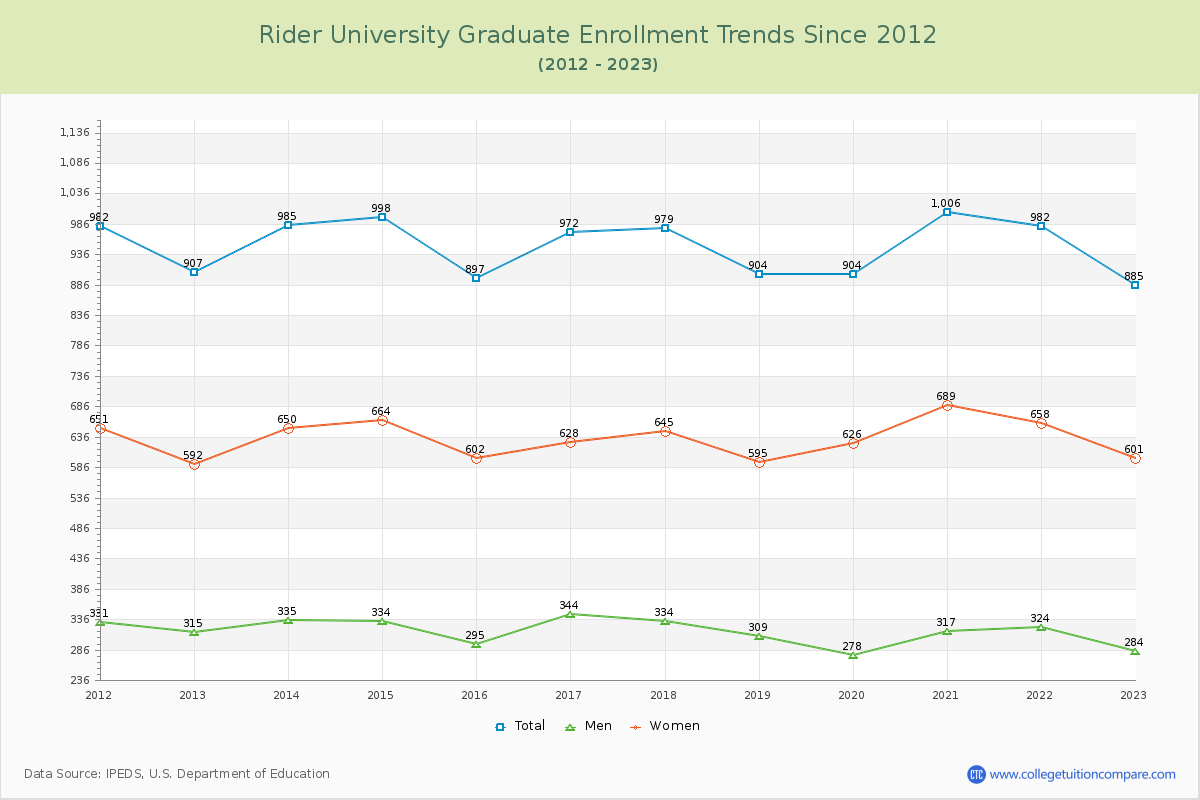
78.17% of total students is undergraduate students and 21.83% students is graduate students. The number of undergraduate students has decreased by 1,409 and the graduate enrollment has decreased by 22 over past 10 years.
The female to male ratio is 1.45 to 1 and it means that there are more female students enrolled in Rider than male students.
The following table and chart illustrate the changes in student population by gender at Rider University since 2012.
| Year | Total | Undergraduate | Graduate | ||||
|---|---|---|---|---|---|---|---|
| Total | Men | Women | Total | Men | Women | ||
| 2012-13 | 5,485 | 4,578 | 1,921 | 2,657 | 907 | 315 | 592 |
| 2013-14 | 5,410 -75 | 4,425 -153 | 1,836 -85 | 2,589 -68 | 985 78 | 335 20 | 650 58 |
| 2014-15 | 5,294 -116 | 4,296 -129 | 1,776 -60 | 2,520 -69 | 998 13 | 334 -1 | 664 14 |
| 2015-16 | 5,069 -225 | 4,172 -124 | 1,778 2 | 2,394 -126 | 897 -101 | 295 -39 | 602 -62 |
| 2016-17 | 5,057 -12 | 4,085 -87 | 1,690 -88 | 2,395 1 | 972 75 | 344 49 | 628 26 |
| 2017-18 | 5,073 16 | 4,094 9 | 1,725 35 | 2,369 -26 | 979 7 | 334 -10 | 645 17 |
| 2018-19 | 4,824 -249 | 3,920 -174 | 1,655 -70 | 2,265 -104 | 904 -75 | 309 -25 | 595 -50 |
| 2019-20 | 4,674 -150 | 3,770 -150 | 1,649 -6 | 2,121 -144 | 904 0 | 278 -31 | 626 31 |
| 2020-21 | 4,636 -38 | 3,630 -140 | 1,533 -116 | 2,097 -24 | 1,006 102 | 317 39 | 689 63 |
| 2021-22 | 4,204 -432 | 3,222 -408 | 1,353 -180 | 1,869 -228 | 982 -24 | 324 7 | 658 -31 |
| 2022-23 | 4,054 -150 | 3,169 -53 | 1,369 16 | 1,800 -69 | 885 -97 | 284 -40 | 601 -57 |
| Average | 4,889 | 3,942 | 1,662 | 2,280 | 947 | 315 | 632 |