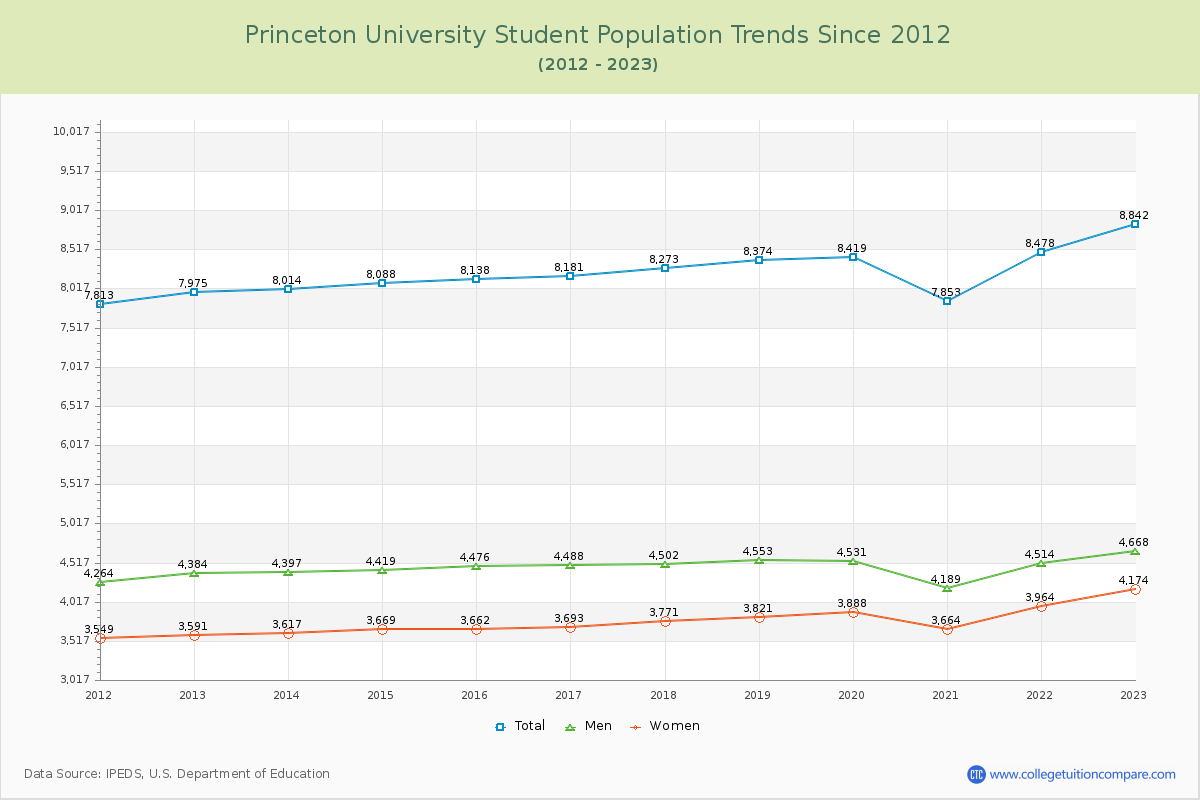
Student Population Changes
The average student population over the last 12 years is 8,240 where 8,842 students are attending the school for the academic year 2022-2023.
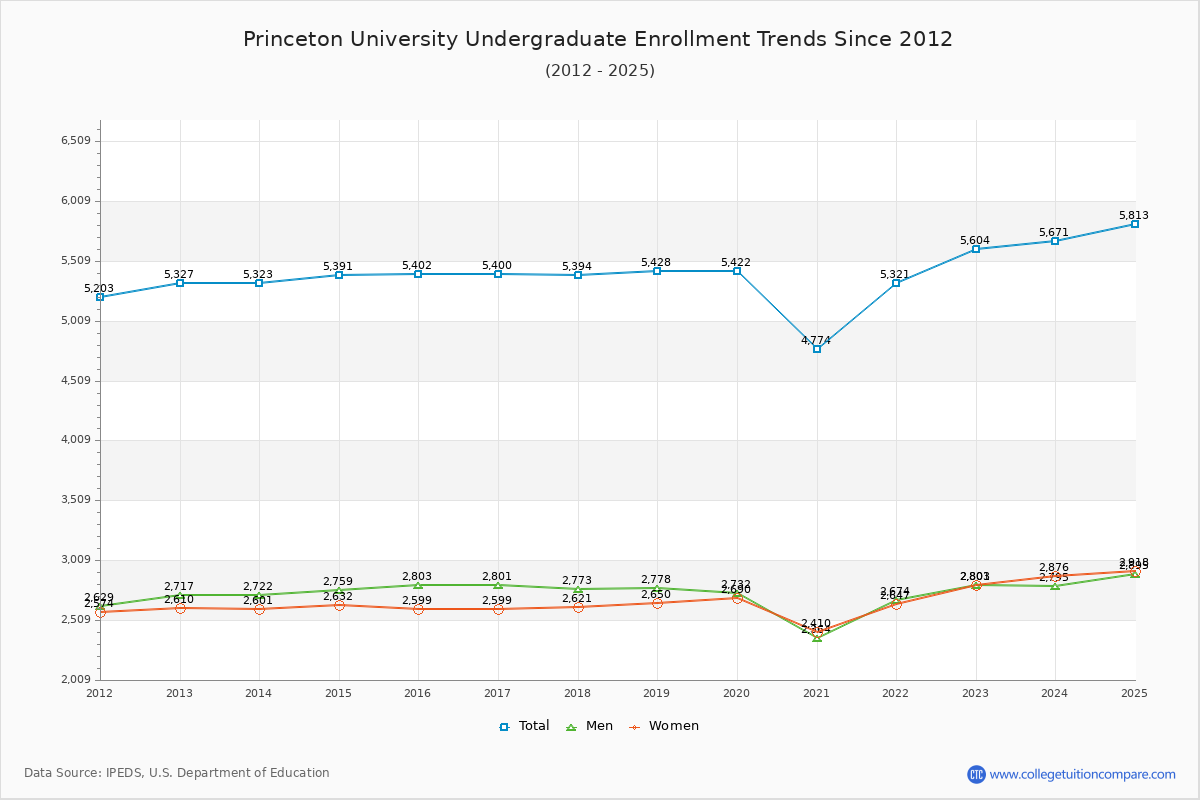
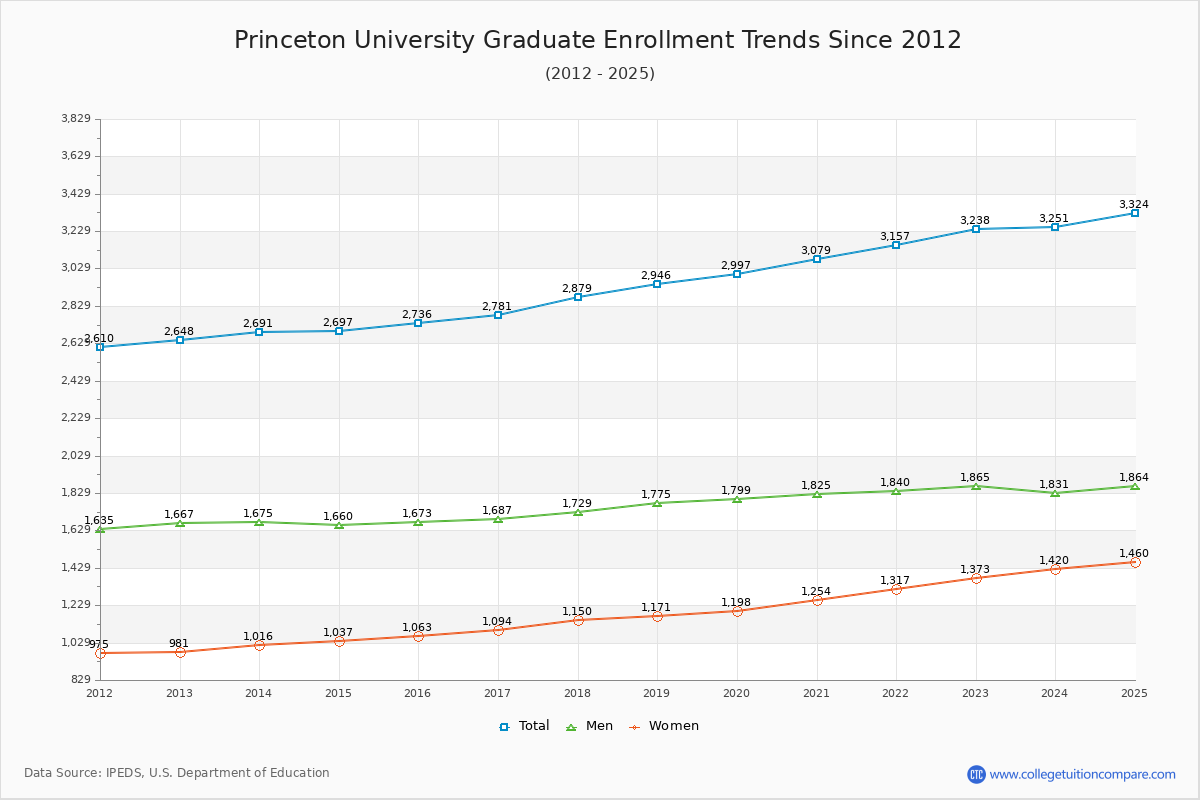
63.38% of total students is undergraduate students and 36.62% students is graduate students. The number of undergraduate students has increased by 277 and the graduate enrollment has increased by 590 over past 10 years.
The female to male ratio is 0.89 to 1 and it means that there are slightly more male students enrolled in Princeton than female students.
The following table and chart illustrate the changes in student population by gender at Princeton University since 2012.
| Year | Total | Undergraduate | Graduate | ||||
|---|---|---|---|---|---|---|---|
| Total | Men | Women | Total | Men | Women | ||
| 2012-13 | 7,975 | 5,327 | 2,717 | 2,610 | 2,648 | 1,667 | 981 |
| 2013-14 | 8,014 39 | 5,323 -4 | 2,722 5 | 2,601 -9 | 2,691 43 | 1,675 8 | 1,016 35 |
| 2014-15 | 8,088 74 | 5,391 68 | 2,759 37 | 2,632 31 | 2,697 6 | 1,660 -15 | 1,037 21 |
| 2015-16 | 8,138 50 | 5,402 11 | 2,803 44 | 2,599 -33 | 2,736 39 | 1,673 13 | 1,063 26 |
| 2016-17 | 8,181 43 | 5,400 -2 | 2,801 -2 | 2,599 0 | 2,781 45 | 1,687 14 | 1,094 31 |
| 2017-18 | 8,273 92 | 5,394 -6 | 2,773 -28 | 2,621 22 | 2,879 98 | 1,729 42 | 1,150 56 |
| 2018-19 | 8,374 101 | 5,428 34 | 2,778 5 | 2,650 29 | 2,946 67 | 1,775 46 | 1,171 21 |
| 2019-20 | 8,419 45 | 5,422 -6 | 2,732 -46 | 2,690 40 | 2,997 51 | 1,799 24 | 1,198 27 |
| 2020-21 | 7,853 -566 | 4,774 -648 | 2,364 -368 | 2,410 -280 | 3,079 82 | 1,825 26 | 1,254 56 |
| 2021-22 | 8,478 625 | 5,321 547 | 2,674 310 | 2,647 237 | 3,157 78 | 1,840 15 | 1,317 63 |
| 2022-23 | 8,842 364 | 5,604 283 | 2,803 129 | 2,801 154 | 3,238 81 | 1,865 25 | 1,373 56 |
| Average | 8,240 | 5,344 | 2,721 | 2,624 | 2,895 | 1,745 | 1,150 |