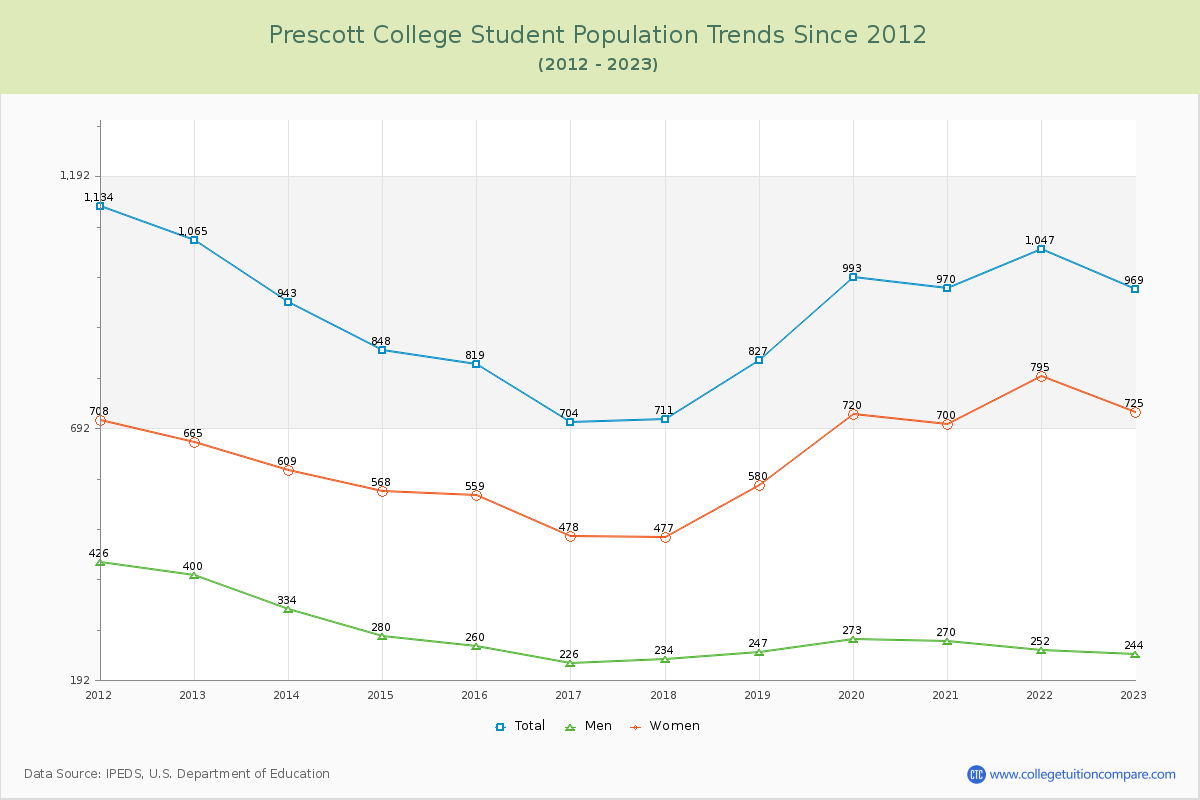
Student Population Changes
The average student population over the last 12 years is 900 where 969 students are attending the school for the academic year 2022-2023.
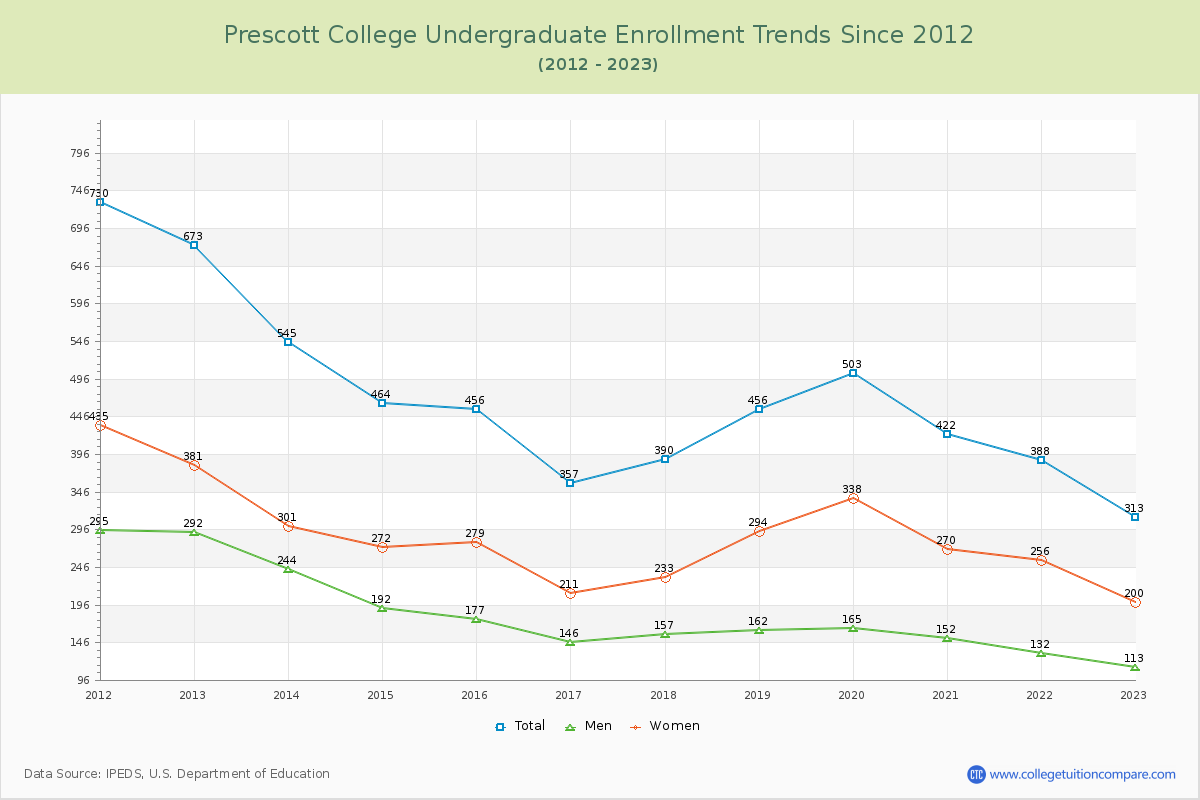
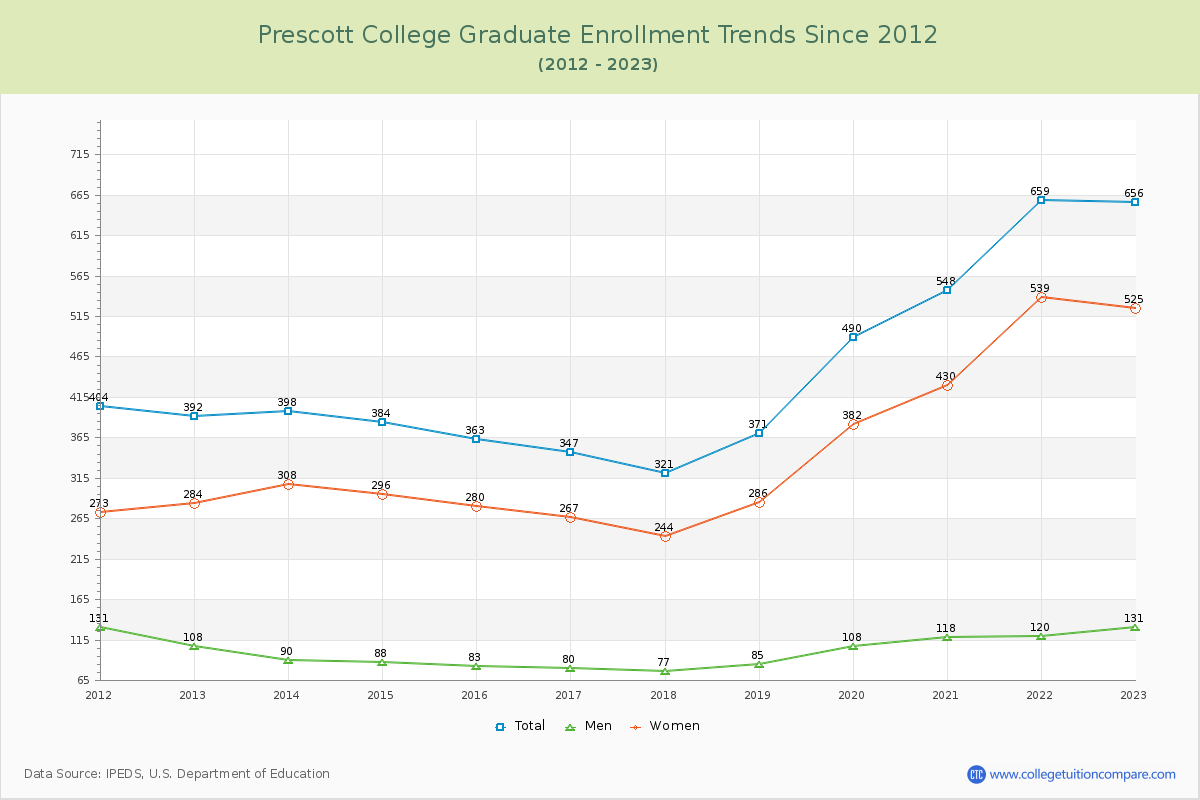
32.30% of total students is undergraduate students and 67.70% students is graduate students. The number of undergraduate students has decreased by 360 and the graduate enrollment has increased by 264 over past 10 years.
The female to male ratio is 2.97 to 1 and it means that there are far more female students enrolled in PC than male students.
The following table and chart illustrate the changes in student population by gender at Prescott College since 2012.
| Year | Total | Undergraduate | Graduate | ||||
|---|---|---|---|---|---|---|---|
| Total | Men | Women | Total | Men | Women | ||
| 2012-13 | 1,065 | 673 | 292 | 381 | 392 | 108 | 284 |
| 2013-14 | 943 -122 | 545 -128 | 244 -48 | 301 -80 | 398 6 | 90 -18 | 308 24 |
| 2014-15 | 848 -95 | 464 -81 | 192 -52 | 272 -29 | 384 -14 | 88 -2 | 296 -12 |
| 2015-16 | 819 -29 | 456 -8 | 177 -15 | 279 7 | 363 -21 | 83 -5 | 280 -16 |
| 2016-17 | 704 -115 | 357 -99 | 146 -31 | 211 -68 | 347 -16 | 80 -3 | 267 -13 |
| 2017-18 | 711 7 | 390 33 | 157 11 | 233 22 | 321 -26 | 77 -3 | 244 -23 |
| 2018-19 | 827 116 | 456 66 | 162 5 | 294 61 | 371 50 | 85 8 | 286 42 |
| 2019-20 | 993 166 | 503 47 | 165 3 | 338 44 | 490 119 | 108 23 | 382 96 |
| 2020-21 | 970 -23 | 422 -81 | 152 -13 | 270 -68 | 548 58 | 118 10 | 430 48 |
| 2021-22 | 1,047 77 | 388 -34 | 132 -20 | 256 -14 | 659 111 | 120 2 | 539 109 |
| 2022-23 | 969 -78 | 313 -75 | 113 -19 | 200 -56 | 656 -3 | 131 11 | 525 -14 |
| Average | 900 | 452 | 176 | 276 | 448 | 99 | 349 |