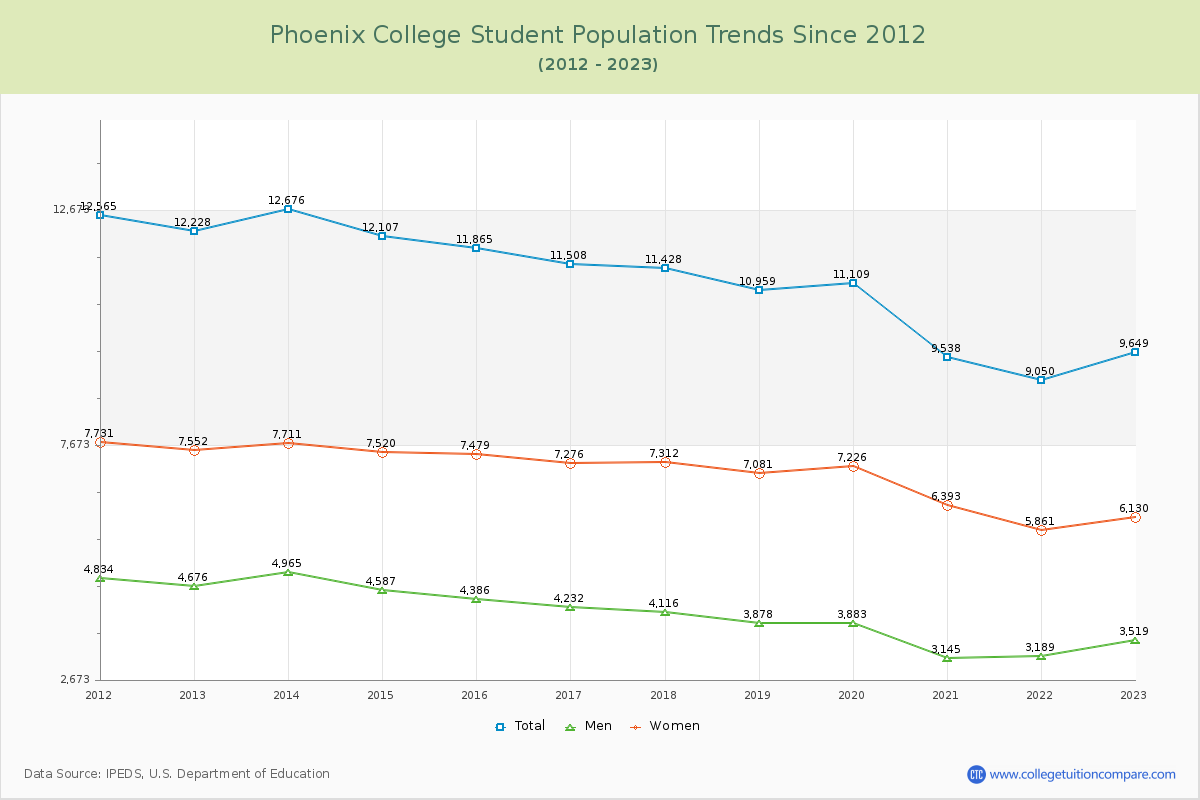
Student Population Changes
The average student population over the last 12 years is 11,102 where 9,649 students are attending the school for the academic year 2022-2023.
The female to male ratio is 1.74 to 1 and it means that there are more female students enrolled in Phoenix than male students.
The following table and chart illustrate the changes in student population by gender at Phoenix College since 2012.
| Year | Total | Men | Women |
|---|---|---|---|
| 2012-13 | 12,228 | 4,676 | 7,552 |
| 2013-14 | 12,676 448 | 4,965 289 | 7,711 159 |
| 2014-15 | 12,107 -569 | 4,587 -378 | 7,520 -191 |
| 2015-16 | 11,865 -242 | 4,386 -201 | 7,479 -41 |
| 2016-17 | 11,508 -357 | 4,232 -154 | 7,276 -203 |
| 2017-18 | 11,428 -80 | 4,116 -116 | 7,312 36 |
| 2018-19 | 10,959 -469 | 3,878 -238 | 7,081 -231 |
| 2019-20 | 11,109 150 | 3,883 5 | 7,226 145 |
| 2020-21 | 9,538 -1,571 | 3,145 -738 | 6,393 -833 |
| 2021-22 | 9,050 -488 | 3,189 44 | 5,861 -532 |
| 2022-23 | 9,649 599 | 3,519 330 | 6,130 269 |
| Average | 11,102 | 4,052 | 7,049 |