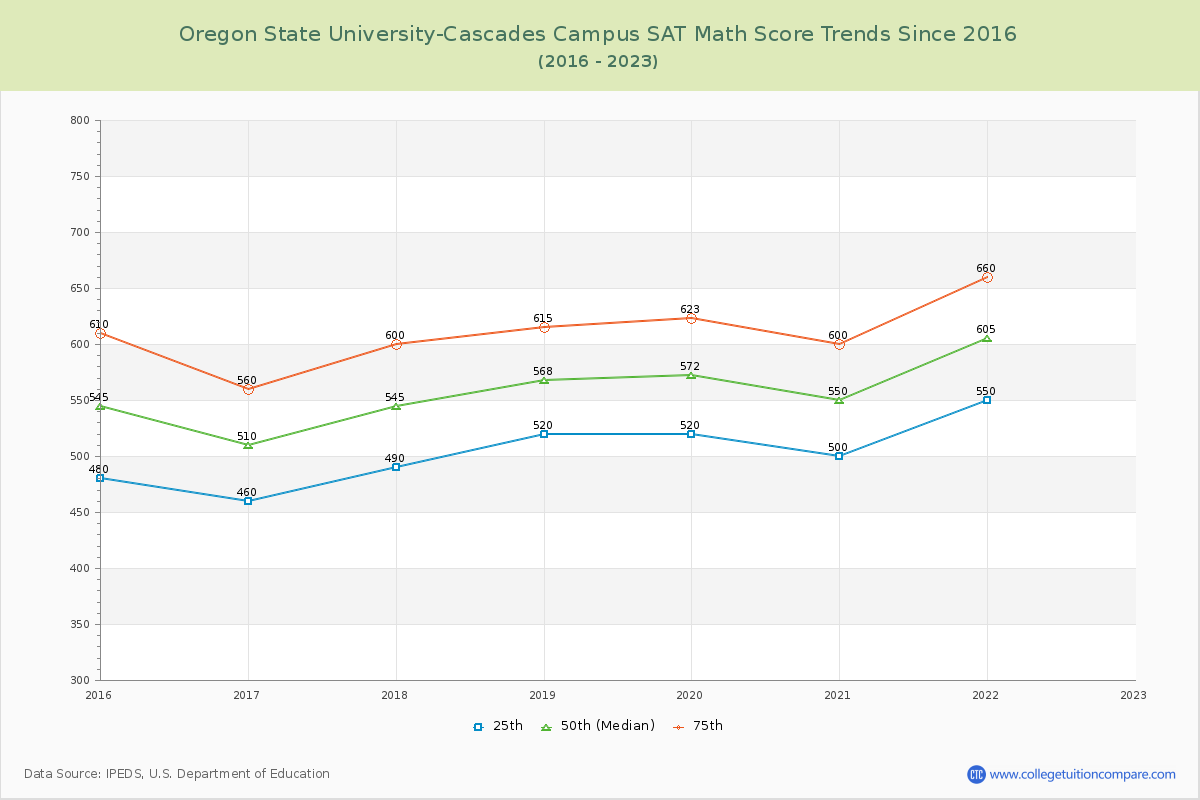
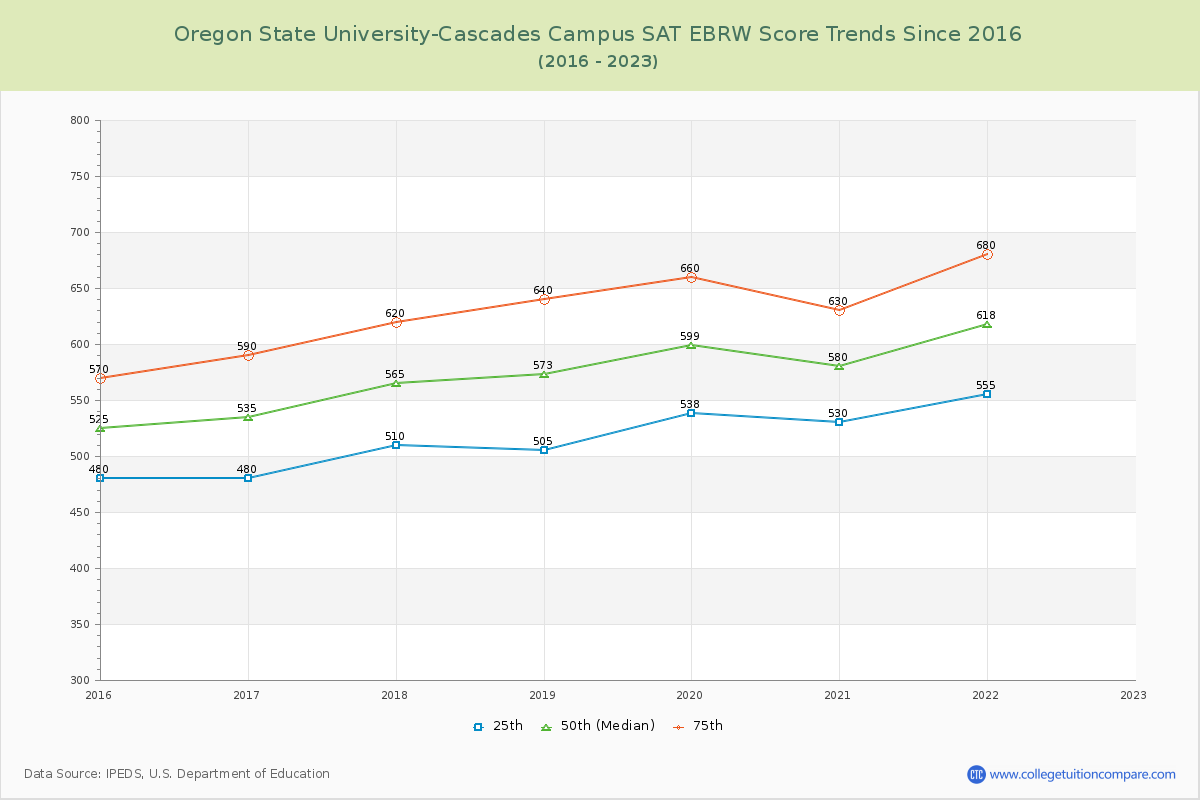
SAT Scores Over Time
The 2023 SAT score is at Oregon State University-Cascades Campus. Over the past 9 years, the average SAT score is 1017 (25th percentile) and 1237 (75th percentile). Compared to similar schools, the submitted SAT scores are around national average at Oregon State University-Cascades Campus.
The following table and chart illustrate the changes in SAT scores at Oregon State University-Cascades Campus since 2015.
| Year | Total | Math | Evidence-Based Reading and Writing | ||||||
|---|---|---|---|---|---|---|---|---|---|
| 25th | 50th | 75th | 25th | 50th | 75th | 25th | 50th | 75th | |
| 2015-16 | 960 | 1,070 | 1,180 | 480 | 545 | 610 | 480 | 525 | 570 |
| 2016-17 | 940 | 1,045 | 1,150 | 460 | 510 | 560 | 480 | 535 | 590 |
| 2017-18 | 1,000 | 1,110 | 1,220 | 490 | 545 | 600 | 510 | 565 | 620 |
| 2018-19 | 1,025 | 1,140 | 1,255 | 520 | 568 | 615 | 505 | 573 | 640 |
| 2019-20 | 1,058 | 1,171 | 1,283 | 520 | 572 | 623 | 538 | 599 | 660 |
| 2020-21 | 1,030 | 1,130 | 1,230 | 500 | 550 | 600 | 530 | 580 | 630 |
| 2021-22 | 1,105 | 1,223 | 1,340 | 550 | 605 | 660 | 555 | 618 | 680 |
| 2022-23 | - | - | - | - | - | - | - | - | - |
| Average | 1017 | 1127 | 1237 | 503 | 556 | 610 | 514 | 571 | 627 |
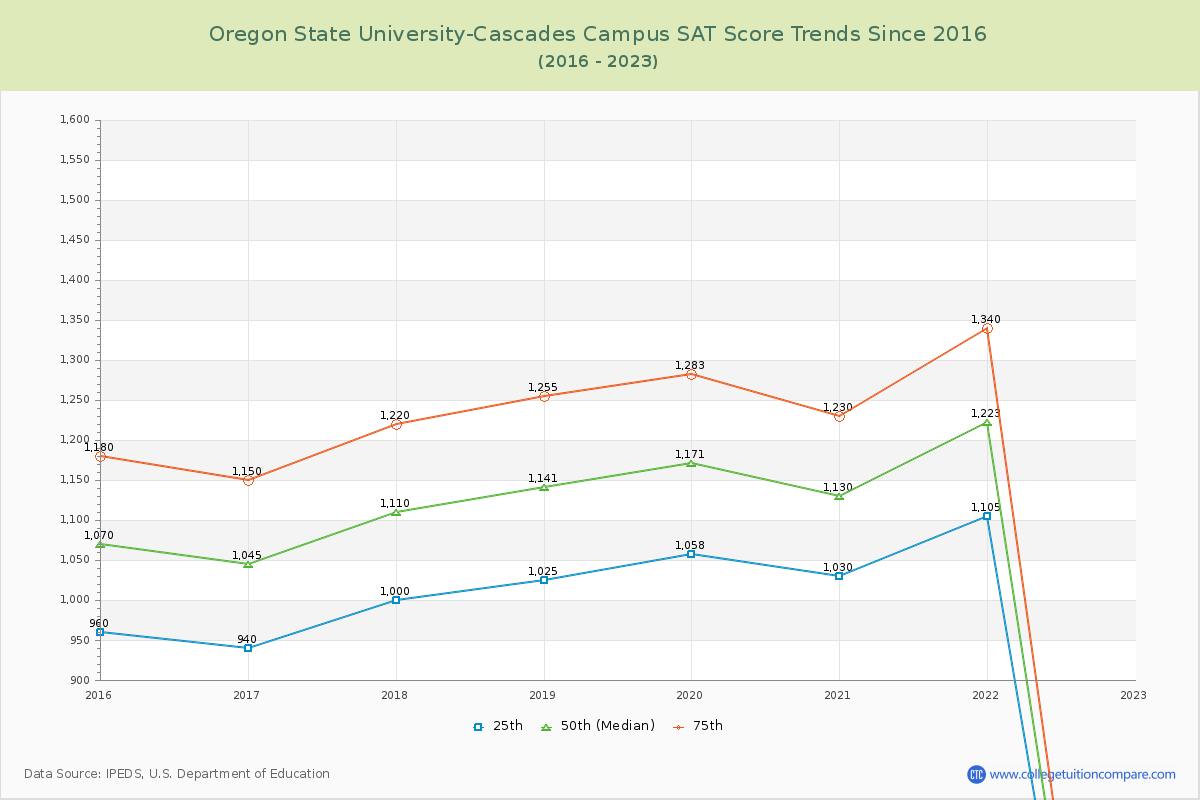
*SAT Evidence-Based Reading and Writing replaces SAT critical reading and writing since year 2017.
**The SAT Writing score is excluded from the total scores for year from 2011 to 2016.